Every bar contains information. You miss a lot of valuable information due to filtering bars by time, variance or some other method. The best solution is to allow these bars to provide you with all the valuable and needed information in a compact and informative manner.
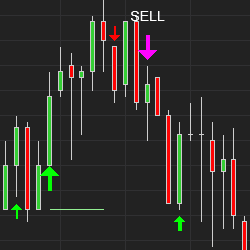
Ultimate Scalper's Signals Indicator has it all: buy and sell signals, trend reversal signals, scalping signals, pullback alerts, and stop loss placement lines. It’s multiple systems all in one. Learn more, watch videos of it in action, and get a 10% discount by clicking the link!
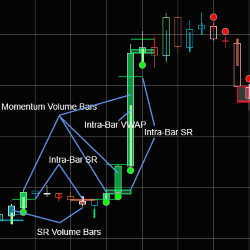
Activity Bars is a unique bar type for NinjaTrader which accounts for every single trading activity. Activity Bars establish both nature price action and trend. They work well in choppy markets by accumulating trading activities of ranges and zones, but also work for trending markets.
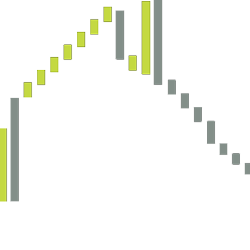
The LogikRenkoStreamline is an improved variant of the traditional Renko Bar type. By granting the ability to set the Reversal Brick size, the bar type will minimize spurious reversal whipsaws.
Day trading E-Mini futures system focused on trading the RTY, NQ, YM, ES and FDAX futures. Combines a proprietary chart, indicators and trade plans, along with a live training room every market session. Completed in thirty minutes or less on most days.
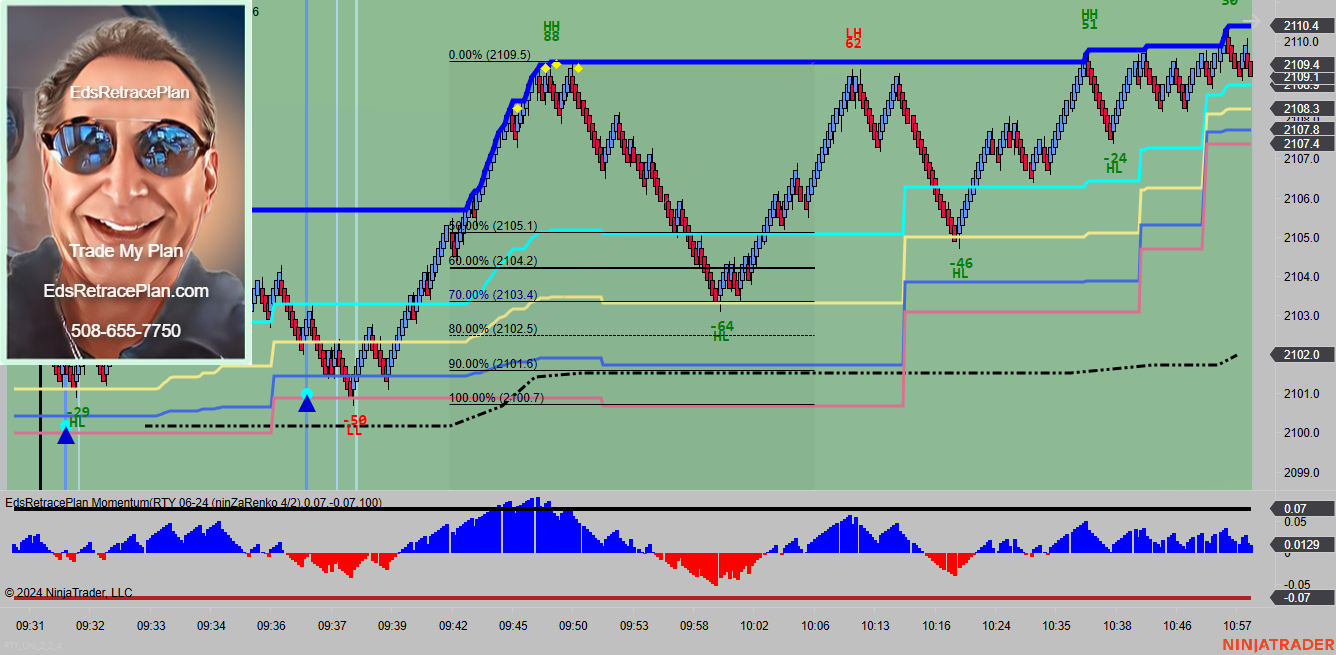
EdsRetracePlan, the innovative system that provides specific day trading signals for ES, YM, RTY, NQ, CL and GC, is now broadcasting live charts to the EdsRetracePlan YouTube channel, daily from 9:00AM to 11:00 EST. For the YouTube URL to this daily show please send an email to [email protected].
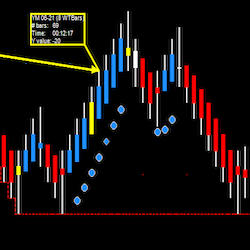
A precise analytical tool derived from statistical trading metrics such as prices and volume, offering insights to inform trading decisions.
Have you ever tried to figure out where to place your profit target to hit your profit goal for the day? Or where to place your stop-loss to avoid max drawdown? Calculate and move your orders in a single click with Quick Trade. Includes commissions and realized P&L.
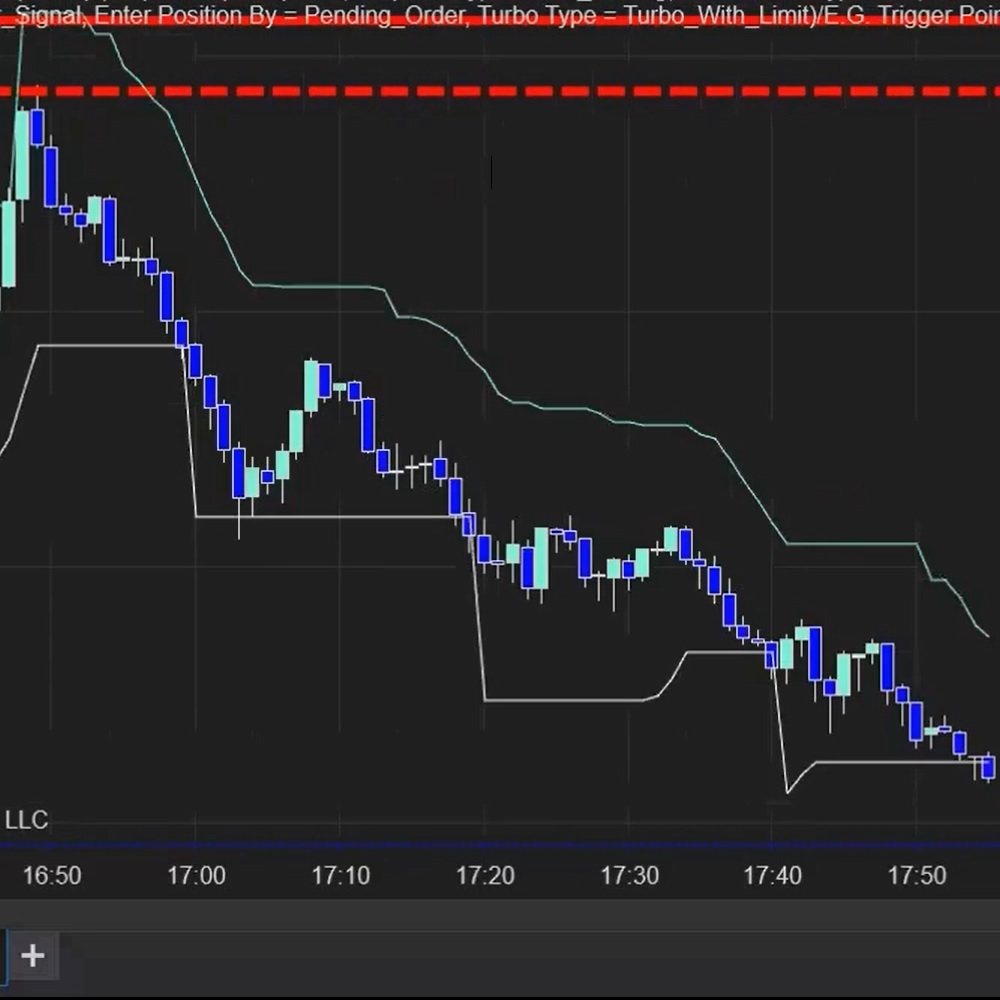
The E.G. Trailing Stop draws the trailing path for you. It considers the asset’s volatility; based on the Average True Range (ATR), it estimates the next price level to optimize your profit targets.
High performance, fully-automated night and day trading for NQ and MNQ. The VX9 wakes up before sunrise and finds the best trading opportunities in the morning twilight. Built from scratch to be a true day trading system, the VX9 offers simplicity and performance.
December 2, 2024
Mastering Sideways Markets With Auction Bars and Range Projections
November 19, 2024
Enhancing Your Automated Trading System: Key Insights from Best Pro Trade
November 14, 2024
NinjaTrader New Ecosystem Tools: October 2024 Edition
Enter Email for Updates