This tool is the ultimate solution to help with your discipline and money management. This will display PNL in ticks or points on your chart, halt your ability to continue trading once you hit your risk limit and will ensure all orders are flattened before halting your trading. Free 7 day trial.
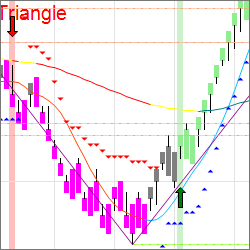
A complete trader's toolbox of 8 custom indicators that are designed to give you a competitive edge in any market. Algorithmic components give actionable trade signals, trends and pattern recognition for day, swing, scalping or trend following trading styles in futures, forex and equities.
By marking the high and low range from 8-9 AM and extending these levels along with the midpoint throughout the session, this indicator provides insights into market dynamics right after the open. Traders can use this information to strategize around the rejection or acceptance of these levels.
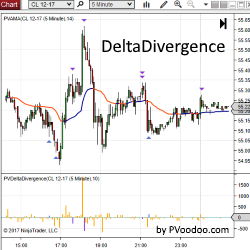
PVDeltaDivergence Indicator is a powerful tool designed to help traders identify possible turning points in their favorite markets with order flow analysis. Get a free trial of PVDeltaDivergence for NinjaTrader today!
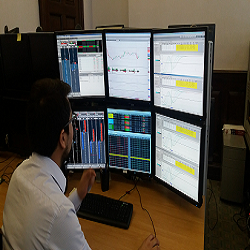
Free daily newsletter - global news & views; free weekly YouTube (Sunday) to prepare you for the week ahead; 1-day workshops; 1-week courses zero to hero; accredited masterclass financial & commodity trading; flexi-masterclass, which includes a free trading challenge; and trader mentoring.
Neural Director advises trade direction and when to enter with the Golden Signal indicator. This toolset includes a predesigned workspace, accurate daily Power Fibs for many futures and forex markets, automatic Fibonacci extensions and automatic ATM entry.
The KwikPop Consistency Program is a 6-month intensive small group study designed to teach traders how to achieve consistent results. The program includes daily tutorial sessions followed by instructor led live market trading. Space is limited, reserve your spot today!
The Volatility Index (VIX) is a real-time market index that represents the market's expectation of 30-day forward-looking volatility. The VIX moves inversely to the indices and is often used as an indicator of upcoming market moves to time precise entries and exits. AKA Fear Gauge or Fear Index
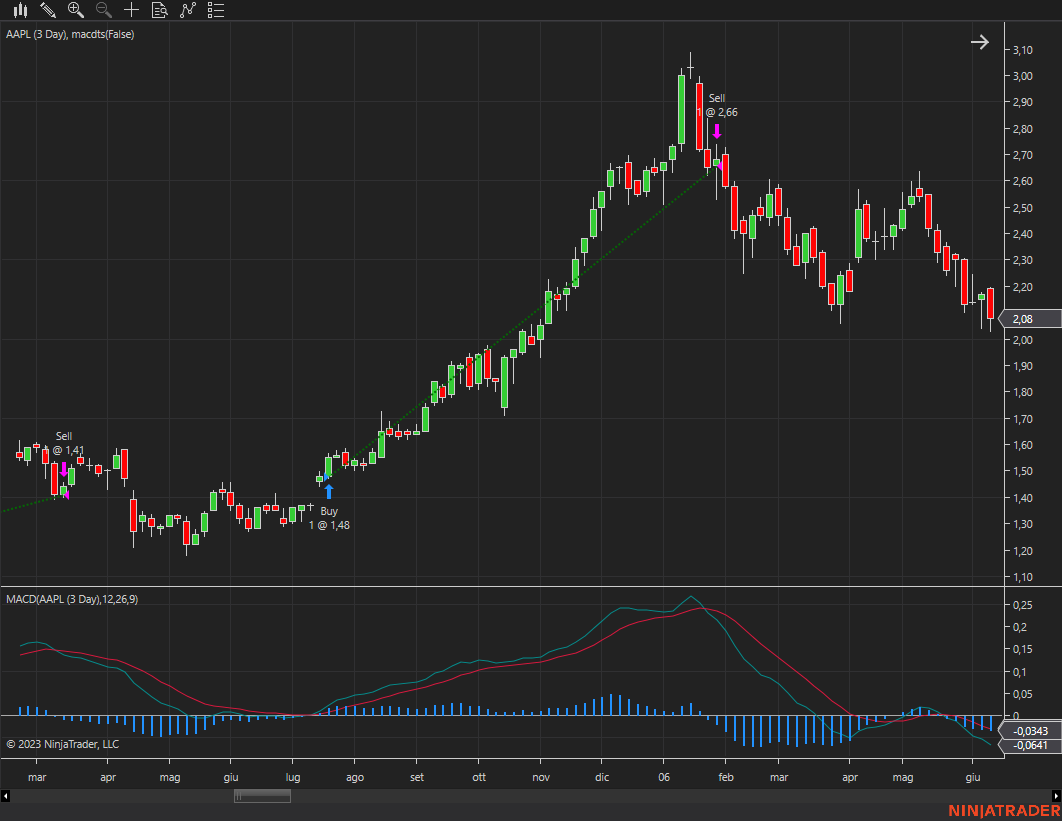
Trading system based on the MACD indicator, exploiting breakouts and trend persistence.
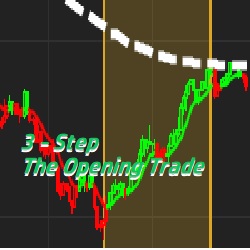
The 3 Step Indicator and Workspace package from The Opening Trade combines three basic elements into a simple Red vs Green color coded, Mean Reversion Discretionary System. Price Action, Trend Strength and Supply and Demand are what drive this 3 Step System.
December 2, 2024
Mastering Sideways Markets With Auction Bars and Range Projections
November 19, 2024
Enhancing Your Automated Trading System: Key Insights from Best Pro Trade
November 14, 2024
NinjaTrader New Ecosystem Tools: October 2024 Edition
Enter Email for Updates