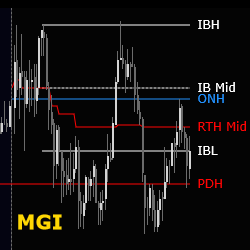
This free MGI (Market Generated Information) indicator automates the process of adding useful information on your chart to help identify trading opportunities, market context and areas of interest to help guide decision making. Three indicators are offered for daily, weekly and monthly time frames.
This indicator plots a 50-bar average of the volume overlaid on the current volume. You can change the number of bars used to calculate the average.
The indicator illustrates volume delta for each bar, emphasizing the contrast between buy and sell volumes. With compatibility for historical and real-time data, it offers diverse display modes. Importantly, users can filter volumes to uncover distinctive behaviors among specific trader groups.
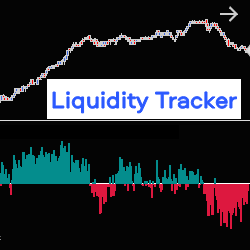
The Liquidity Tracker allows you to monitor, in real time, liquidity variations in the Order Book (pending orders at Bid & Ask), on one or two correlated instruments, at the same time. It therefore allows you to follow the evolution of the market based on the strength of supply or demand.
Automatic ATM Entry Assistant (AUTOBOT) can be used with our indicators and others using native Ninjatrader 8 Arrows or Triangles on the chart. Set up complex entry parameters without coding. Continue to our product page to see the 25-minute video of how it works.
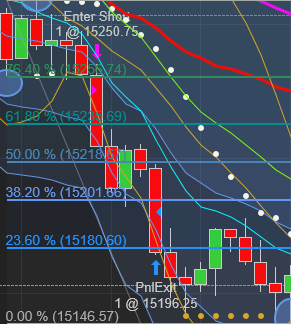
The Price Action Analyzer helps identify and alert price action events when the market enters your reversal area. This tool supports Hidden Gap Bars, Inside/Outside Bars, Up Thrust and Spring, No Demand and No Supply, Effort to Rise, Effort to Fall and Stopping Volume!
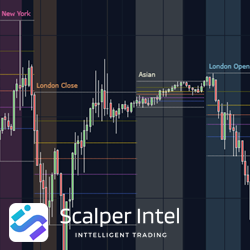
Elevate your trading strategy with the ICT KillZones Indicator for NinjaTrader 8. Highlighting ICT Killzones and integrating Fibonacci retracements, it identifies optimal entry points during high-volatility periods. Features include predefined and customizable sessions & automated time conversions.
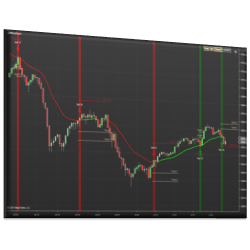
Experience trading evolution with our automated bot! Powered by a dynamic trailing trend system, it adapts to market shifts for optimal entries and exits. Elevate your strategy now!
This indicator plots signals, targets, and stops based on support and resistance from various moving average types. The trend is established based on a minimum number of bars above or below the moving average. The signal is initiated on the first touch of the moving average.
Day Trading Course with Order Flow analysis and live trading sessions.
December 2, 2024
Mastering Sideways Markets With Auction Bars and Range Projections
November 19, 2024
Enhancing Your Automated Trading System: Key Insights from Best Pro Trade
November 14, 2024
NinjaTrader New Ecosystem Tools: October 2024 Edition
Enter Email for Updates