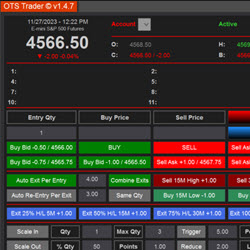
Uniquely streamlines your daily trading tasks, automating processes that would otherwise require manual effort. Organized into four key sections — first entry, second entries, auto stops and auto exits. Plus more.
PFAZoneSuite is advanced supply and demand trading! Indicator package includes automated volume zones, volume profile, order flow analytics, trend lines, fibonacci retracements, market structure, trade data box and more! Compatible with NinjaTrader 8. Click here for a free demo!
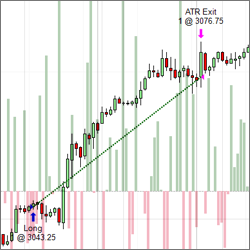
Fully automated E-mini trading systems. These auto traders are designed to operate continually and without any human intervention. All of our systems have gone through extensive testing to ensure that hypothetical backtests are as closely representative of a live trading environment as possible.
For anyone looking for a more reliable way to get results in the markets: Volume Profile is a professional charting tool that provides real-time market generated information (unlike most technical indicators that are weak & lag). Build your trading business around powerful tools & methods like VP.
The Tradesight Plus Subscription includes access to their live Trading Lab, a suite of ten NinjaTrader add-on tools, plus all their stocks, futures, Forex, and options calls throughout the day. The subscription also includes the Tradesight Forex and Futures Levels.
Epic Follow measures an instrument’s correlation to another instrument and, if a big movement is made, triggers a trade. Strategy optimization (templates provided) provide trade setups based on historical performance. It is multi-timeframe and supports futures, equities, and crypto! Download trial!
Volume Profile is a very well-known and very much-used indicator in trading, but with a twist! Our indicator will give you the ability to automatically anchor it to various starting points and, better yet, use it in your automated strategies and backtesting.
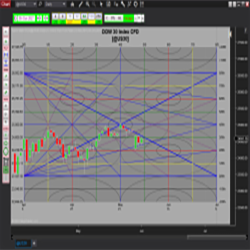
Samri Math Price-in-Time is a comprehensive tool for traders using Murrey Math methodology. This indicator calculates not just PRICE levels, but also sets the price in TIME. Easily switch between time frames (day or minute only) with the user-friendly interface.
This Order Flow indicator package takes the information overload out of interpreting complex footprint charts and volume data by doing the calculations internally, and then plotting easy to read objects on the chart. Your membership includes the software, one month trade room access and mentorship.
Weekly one-on-one coaching tailors trader development to the individual. Evening Chartbook & Market Recap, Daily Briefing and Sunday Evening Review reinforce technical and fundamental development and guide the practical application of tools, methods and strategy maturing into Best Practices.
December 2, 2024
Mastering Sideways Markets With Auction Bars and Range Projections
November 19, 2024
Enhancing Your Automated Trading System: Key Insights from Best Pro Trade
November 14, 2024
NinjaTrader New Ecosystem Tools: October 2024 Edition
Enter Email for Updates