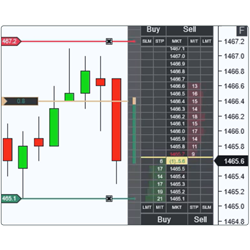
Chart trading at its best! A scalable Chart DOM with one-click order entry and position management. Move your stops and targets in an instant. Market Depth includes a histogram, allowing you to see large-size bid or ask price levels. Over 75 properties to personalize the look and feature selection.
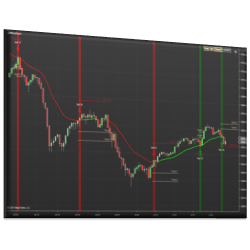
This indicator plots signals, targets, and stops based on support and resistance from various moving average types. The trend is established based on a minimum number of bars above or below the moving average. The signal is initiated on the first touch of the moving average.
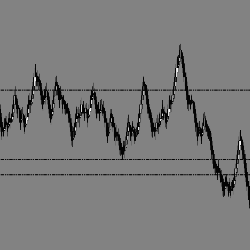
EPyFClimaxVolume is an indicator which designates climax areas within intraday charts. It also identifies important entry & target levels for day trading. You can customize the indicator levels within each chart.
A cutting-edge indicator designed to make order flow trading both effective and enjoyable. Featuring an intuitive footprint chart, it provides valuable insights into historical and real-time market activity. The footprint chart reveals buy and sell volumes and order flow within each price bar.
TradeFoxx is an automated trading software designed for the NinjaTrader Desktop platform, version 8. It supports trading in Forex, Futures, and Equities, and offers full automation with time frame control. A free 30-day trial is available, allowing you to test the product before making a purchase.
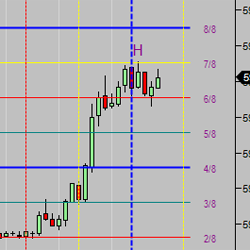
Why use a Murrey Math indicator that calculates only once or hourly instead of by the rules? MMlinesProPlus can do that. Traders also see where the lines recalculated and shifted. In Historical Mode, see the lines where they actually were at various times. It includes adjustable frame size and more.
If you're serious about learning to trade forex, this is the program for you. It includes all the knowledge and tools you need to succeed as a forex trader, and all taught in live markets with two seasoned traders. So grab your seat now, and start trading with confidence.
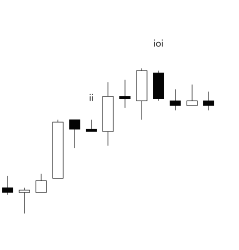
Breakout Mode Patterns from Brooks Price Action methodology.
Storm Eye enhances trading accuracy by leveraging fake breakouts to pinpoint optimal entry points, offering a sophisticated and reliable method for navigating market turbulence. It operates through a three-step process: Identifying a breakout, detecting a breakaway, and generating a signal.
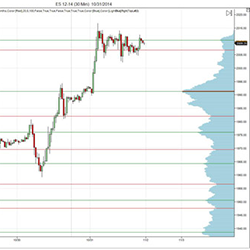
A1VolumeProfile is an easy way to add intraday and composite volume profiles to any chart. High and low volume nodes can indicate high probability areas for price predictability, and value areas indicate high probability areas for potential intra-day trend changes. Download a free trial!
December 2, 2024
Mastering Sideways Markets With Auction Bars and Range Projections
November 19, 2024
Enhancing Your Automated Trading System: Key Insights from Best Pro Trade
November 14, 2024
NinjaTrader New Ecosystem Tools: October 2024 Edition
Enter Email for Updates