Creating custom algorithmic trading solutions that provide out of the box edge.
With a potential of 1 trade per day, this system is automated from start to finish & designed to be monitored in some capacity. If you can remotely access a computer with the right software, then you can monitor these automated trades from the golf course (with a strong cell signal).
This is a breakout trading strategy using an ATR trailing stop as exit.
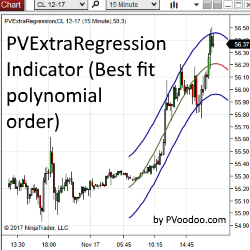
PVExtraRegression Indicator & Strategy is a regression channel taken to the next level, calculated using higher order polynomials. Use PVExtraRegression as a discretionary indicator or automated strategy!
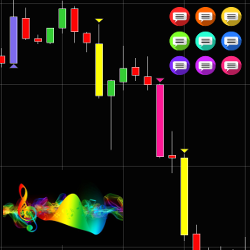
Highly customizable indicator allowing traders to track volatility without spending time staring at a screen. Candlesticks are represented by different custom colors depending on the direction of price movement & its amplitude. Notifications are also sent via email, text or by your favorite sound.
Visually add buying and selling pressure analysis and time & sales data to any chart. See the pace of the tape and order flow analytics in an easy to understand tape speed monitor format that allows you to quickly read the tape. The Geiger Counter is an instantaneous indicator of order flow shift.
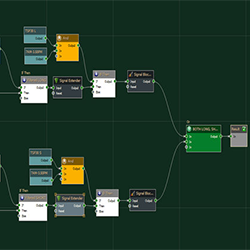
Custom strategy design in BloodHound. Remek! will program your trading strategy as per your specifications and requirements. Learn more!
This is the ultimate mean Renko version (with wicks) for NinjaTrader 8. It removes noise and helps visualize trends. ninZaRenko can be used for charting, trading, backtesting, and programming. It is trusted and loved by thousands of traders worldwide. Download free now!
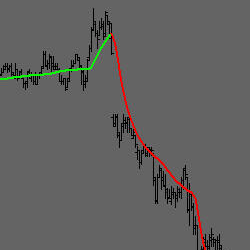
PLA Dynamical GOLD is a complex moving average that has 101 different speeds per length, overshoot true or false input, anti-reverse true or false input, and anti-reverse percentage adjustment. Also included is a fast start algorithm which requires only 10 bars of data to compute an output value.
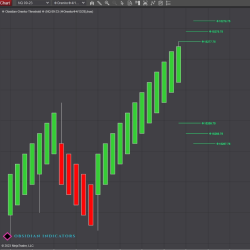
Orenko bars focus on price movements, filtering out market noise and providing a clear representation of trends and reversals, making it easier for traders to identify trading opportunities. Orenko Threshold highlights the potential formation of the next three bars trend and reversal threshold.
December 2, 2024
Mastering Sideways Markets With Auction Bars and Range Projections
November 19, 2024
Enhancing Your Automated Trading System: Key Insights from Best Pro Trade
November 14, 2024
NinjaTrader New Ecosystem Tools: October 2024 Edition
Enter Email for Updates