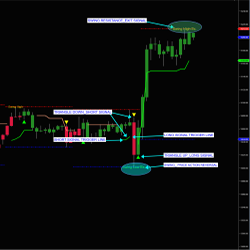
Reversal Bars is an indicator showing you when & where it will plot a reversal bar from as many as five times frames on a single chart.
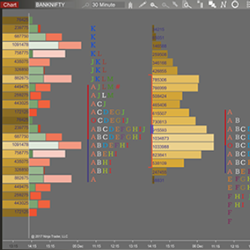
Bell Market Profile aims to help traders visualize what is actually happening in the market by displaying where trades are occurring. It features split vs composite profile, high volume alerts, absolute volume profile all with customizable colors.
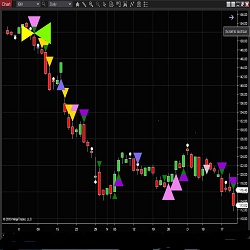
MagnaST122 and PAR Swing Indicator. Long: When price touches the moving average trigger line, a triangle up long signal triggers. Short: When price touches the moving average trigger line, a triangle down short signals. Swing low and swing high signal potential exit and/or price action reversal.
This package includes 30 indicators! Apply them all to one chart or individually. Each indicator has a unique plot style and color, creating signals with multicolor combinations. Click to learn more.
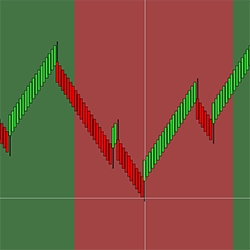
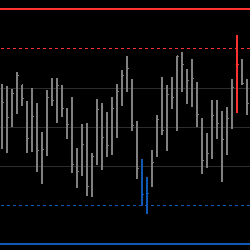
The Value Chart Indicator draws bars over a dynamically created scale from the last highest to the lowest values over a period. It attempts to spot market oversold and overbought areas on a short time scale, when price is most probable to revert to its mean.
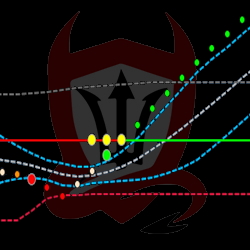
TradeDevils Indicators offers unique indicators for NinjaTrader 8. Regardless of whether you are a scalper, a trend follower or a breakout trader, they can provide you with the right indicators to assist with your trading.
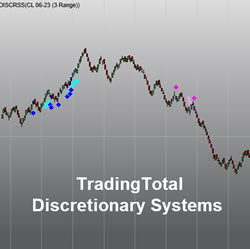
TradingTotal Discretionary Systems replicates several popular TradingTotal automated strategies entry rules for manual trading modality for future instruments.
Innovative Trading Solutions has been building indicators, fully-automated or ATM Strategies, chart types, and chart styles to client specifications for over 8 years. They also offer NinjaTrader 7 to NinjaTrader 8 conversion services. Get a free quote for your project today!
In this course you will learn how to code add-ons for NinjaTrader 8. It consists of over 10 lectures on how to create custom windows, pass data from strategies into add-ons, create beautiful charts using 3rd party libraries and use statistics to find new ideas for building systems.
Get your trade information at-a-glance. Adding the Status Box on your chart allows you to see your relevant trade stats instantly.
December 2, 2024
Mastering Sideways Markets With Auction Bars and Range Projections
November 19, 2024
Enhancing Your Automated Trading System: Key Insights from Best Pro Trade
November 14, 2024
NinjaTrader New Ecosystem Tools: October 2024 Edition
Enter Email for Updates