The ultimate semi-auto trading strategy that harnesses the power of a premier indicator, Peaks. This innovative tool gets you into trades, automatically as a signal is generated, eliminating the need for manual entries. Peak's Semi Auto also offers automated exits, using their custom Auto PT logic.
Trail a stop automatically behind a wide range of indicators: Price Action, ATR, Bollinger Band, Swing, Parabolic SAR, Donchian Channel, or 9 different Moving Averages. Trailing Stop Expert works on Futures, Forex or Stocks. Grab a 7-day free trial now!
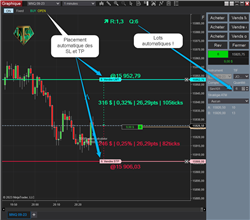
This indicator will automatically calculate for you the quantity of lots according to the position of StopLoss and the risk as a percentage of your capital. It will also place your StopLoss and TakeProfit. Finally get constant risk by trading on Futures contracts!
Stocks, futures and forex trading analysis education via daily coaching and education using an institutional order flow methodology. Unlimited mentorship, an advanced curriculum course, trading software, forum and class recordings are all included! Learn More!
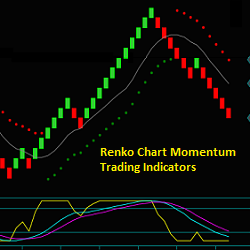
The Renko chart trading method and trading indicator training include Renko chart momentum reverse trades that begin a new swing, trading pullbacks with momentum resumption and flow for price continuation, and trading swing reverses with price and momentum extremes or divergences.
Streamline your trading with semi-automated tools that efficiently manage positions, whether long or short, across specific instruments in your account.
Speeding Trading Servers offers high performance co-located virtual & dedicated servers (VPS) for professional & retail traders. Optimize fills, reduce slippage & run automated trading strategies 24/7 from any location. Sign up for a free one week trial today!
Join the PFA Community and get the Supply Demand Trading Course, Software licenses, forum access, live training room and more! Monthly, yearly & lifetime license packages available!
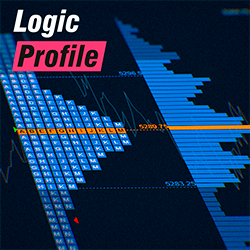
Includes volume profile and TPO market profile, presets for one-click charting, daily, weekly, monthly, date, composite, and drawn profiles. Offers defined or continuous session types and load optimization. All of these features make it one of the most advanced profiles available on the market.
Learn how to identify institutional algorithms and trade like the pros! This course for experienced/advanced traders will take you through advanced strategies and preparations for trading index futures. Traders who purchase this course will also gain access to private slack channels.
December 2, 2024
Mastering Sideways Markets With Auction Bars and Range Projections
November 19, 2024
Enhancing Your Automated Trading System: Key Insights from Best Pro Trade
November 14, 2024
NinjaTrader New Ecosystem Tools: October 2024 Edition
Enter Email for Updates