This model tracks a universe of approximately 30 equities from industries related to green transportation. This includes suppliers and manufacturers of components, batteries, fuel cells, sensors, autonomous vehicles, power trains, etc. Contact Alpha Vee for more information.
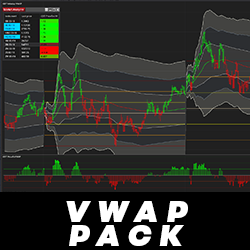
The VWAP Pack includes a VWAP Indicator with current and previous levels, a Price to VWAP indicator to output the position of price, and a Market Analyzer template! With the Price to VWAP indicator, it is easy to monitor the position of price in relation to the current VWAP.
A unique course with a specific, rule-based & mechanical/objective trading methodology. Designed to help traders identify entries & exits, define size, manage risk & control emotions when trading Futures Markets with their own characteristics & terminology. Get FREE access to the patented AutoUFOs®.
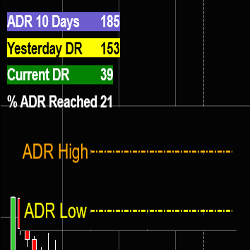
This highly customizable NinjaTrader 8 indicator displays the average daily range allowing users to spot related trading opportunities. T2SSmartADR also provides notifications when the average daily range is reached and when there is a high probability of reversal trades.
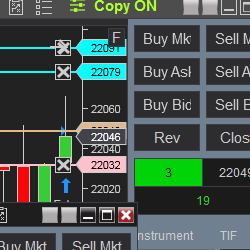
Replicate orders from a master account/master instrument to one or more slave accounts/slave instruments. The Replicator was designed for Micro E-mini trading and managing multiple accounts with a single instance of NinjaTrader 8.
Momentum indicator
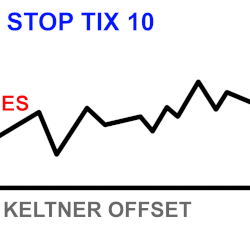
Stop Keltner uses Keltner Band distance to help give an estimated stop-loss in ticks, which is displayed in an easy-to-read text box on the chart. It’s also an excellent backtesting tool for getting estimated stops when identifying past trade entries on historical bars. Built for ES momentum traders
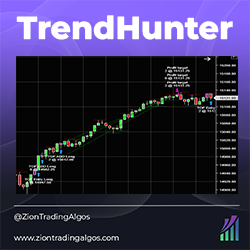
TrendHunter is an EMA based intraday strategy on the 5 minute chart. It has a built-in volatility centric model. It performs well on trending days in the market, and is designed to reduce risk and take a smaller position size if the market is not in a trend.
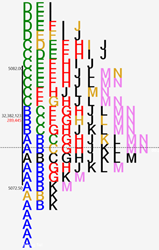
Elevate your market analysis with advanced features. This tool offers automatic reference lines, alternate volume figures and various displays like TPO profiles and volume at price. It integrates Jim Dalton studies and provides detailed reports on weak references and volume distribution.
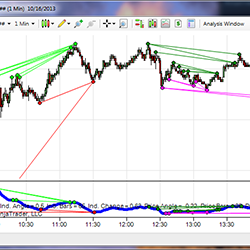
The Divergence Indicator for NinjaTrader utilizes a sophisticated algorithm to detect divergence, and eliminates some shortcomings of typical divergence indicators. It can be calculated using any indicator within NinjaTrader (ex. RSI, MACD, Stochastic, or any custom indicators).
December 2, 2024
Mastering Sideways Markets With Auction Bars and Range Projections
November 19, 2024
Enhancing Your Automated Trading System: Key Insights from Best Pro Trade
November 14, 2024
NinjaTrader New Ecosystem Tools: October 2024 Edition
Enter Email for Updates