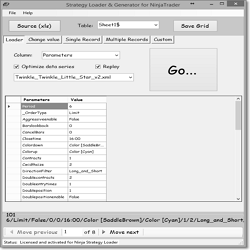
The Ninja Strategy Generator allows traders to make changes to the Parameters record that exports from NinjaTrader to create new strategies with slight variations of the strategy you wish to optimize.
The Multiple MA Cross indicator plots a fast and a slow moving average. For both averages, users may select from over 30 different algorithms. The indicator can be used as a trend filter or for determining support and resistance.
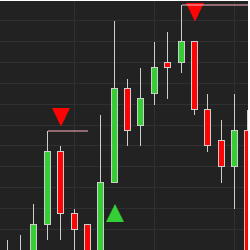
New "Ultimate A.I." indicator has it all: buy and sell signals, trend reversal signals, scalping signals, pullback alerts and stop loss placement lines. It’s multiple systems all in one. Learn more! Watch a demo tutorial by clicking the link! We also have a private chat group. Get a 5 day trial!
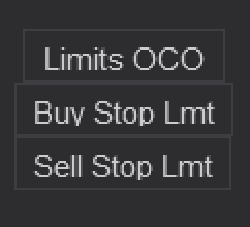
Bars Edge Trader Button and OCO Timer pack for NinjaTrader 8. An easy fast solution to apply Limit Orders to your Chart Trader. Included are three timers for adding OCO Limits entries throughout the day to catch a news cycles semi-automatically.
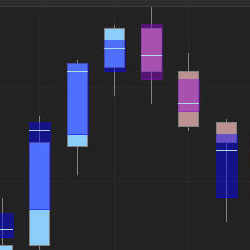
Highlight the Value Area (VA) & Point of Control (POC) of every single candle on your chart, or filter candles with high volume only. The Value Area is colored by the Bid/Ask delta. Get started with a free 7-day trial today!
The Sigmalab team is specialized in financial software design and development. They offer custom trading system and indicator programming services and market analysis tools for the NinjaTrader platform.
Get Integrated Basic and Advanced Training in a full-year trader development program. This program includes access to live online Basic and Advanced Training events in addition to on-demand learning modules. Designed for those who can commit to 1-3 hours of trader development per day.
The TrendLord indicator is a chart overlay indicator that can be used as a confirmation indicator. It is a derivative of a smoothed moving average but with the advantage of representing it as a colored change histogram. Click to learn more.
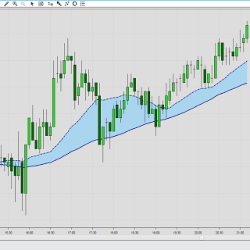
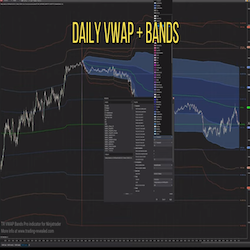
The VWAP Bands Pro indicator for NinjaTrader 8 is a must-have for traders who want to see the market map in real time along with precise support/resistance levels used by the big firms algorithm.
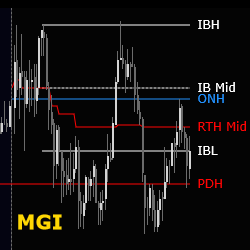
This free MGI (Market Generated Information) indicator automates the process of adding useful information on your chart to help identify trading opportunities, market context and areas of interest to help guide decision making. Three indicators are offered for daily, weekly and monthly time frames.
December 2, 2024
Mastering Sideways Markets With Auction Bars and Range Projections
November 19, 2024
Enhancing Your Automated Trading System: Key Insights from Best Pro Trade
November 14, 2024
NinjaTrader New Ecosystem Tools: October 2024 Edition
Enter Email for Updates