The value area reveals market sentiment by highlighting where most trading activity has occurred, aiding traders in understanding the prevailing market mood. It identifies key support and resistance levels based on trading activity, facilitating entry and exit points for traders.
The OTM Micro Delta indicator allows you to identify buying or selling interest. With a reference threshold, it filters out significant movements. It is useful for detecting large price movements.
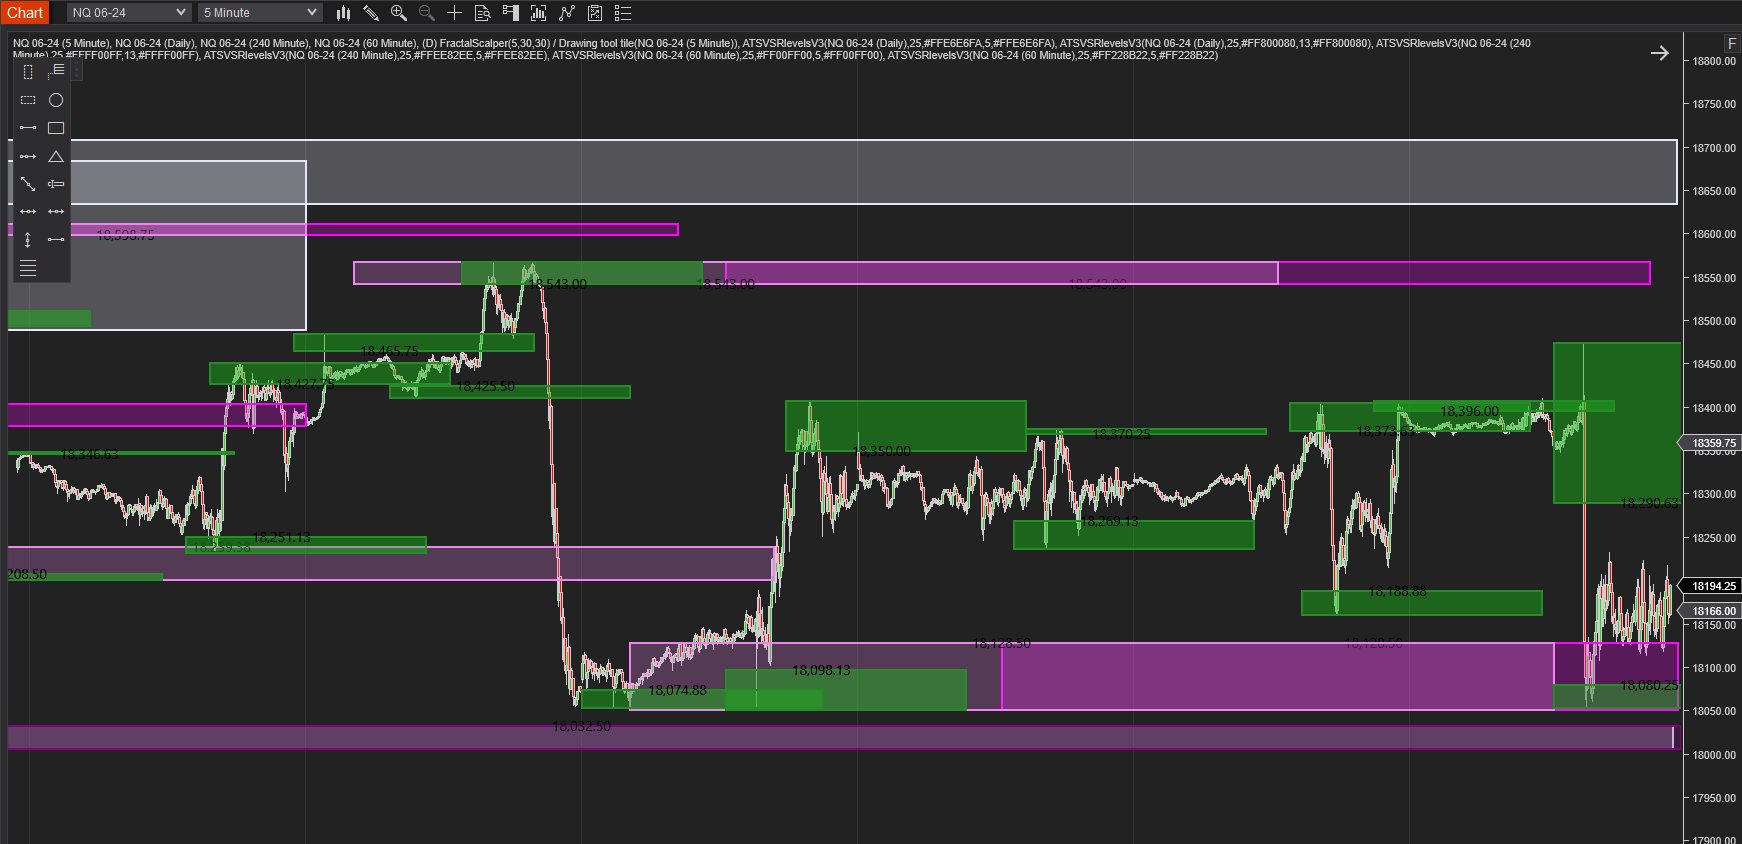
This indicator is designed to provide the trader with better trade locations by plotting visual support and resistance levels at swing points in the market. When multiple data series are used, the ATS VSR Levels can be plotted using the higher timeframe.
Hawkeye Standard Package is Hawkeye Traders' most popular indicators, providing trend and volume analysis across multiple markets. These powerful indicators tell traders when a trend is commencing, in congestion, and where to find the correct exit. Buy now using code: “NT10Off” for a 10% discount!
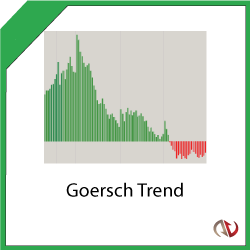
Confirm trend direction with this unique & proprietary indicator. It can be combined with any trading strategy to provide extra confirmation & is ideal for validating your open trades. It works out-of-the-box with no parametrization needed & detects Up and Down trends.
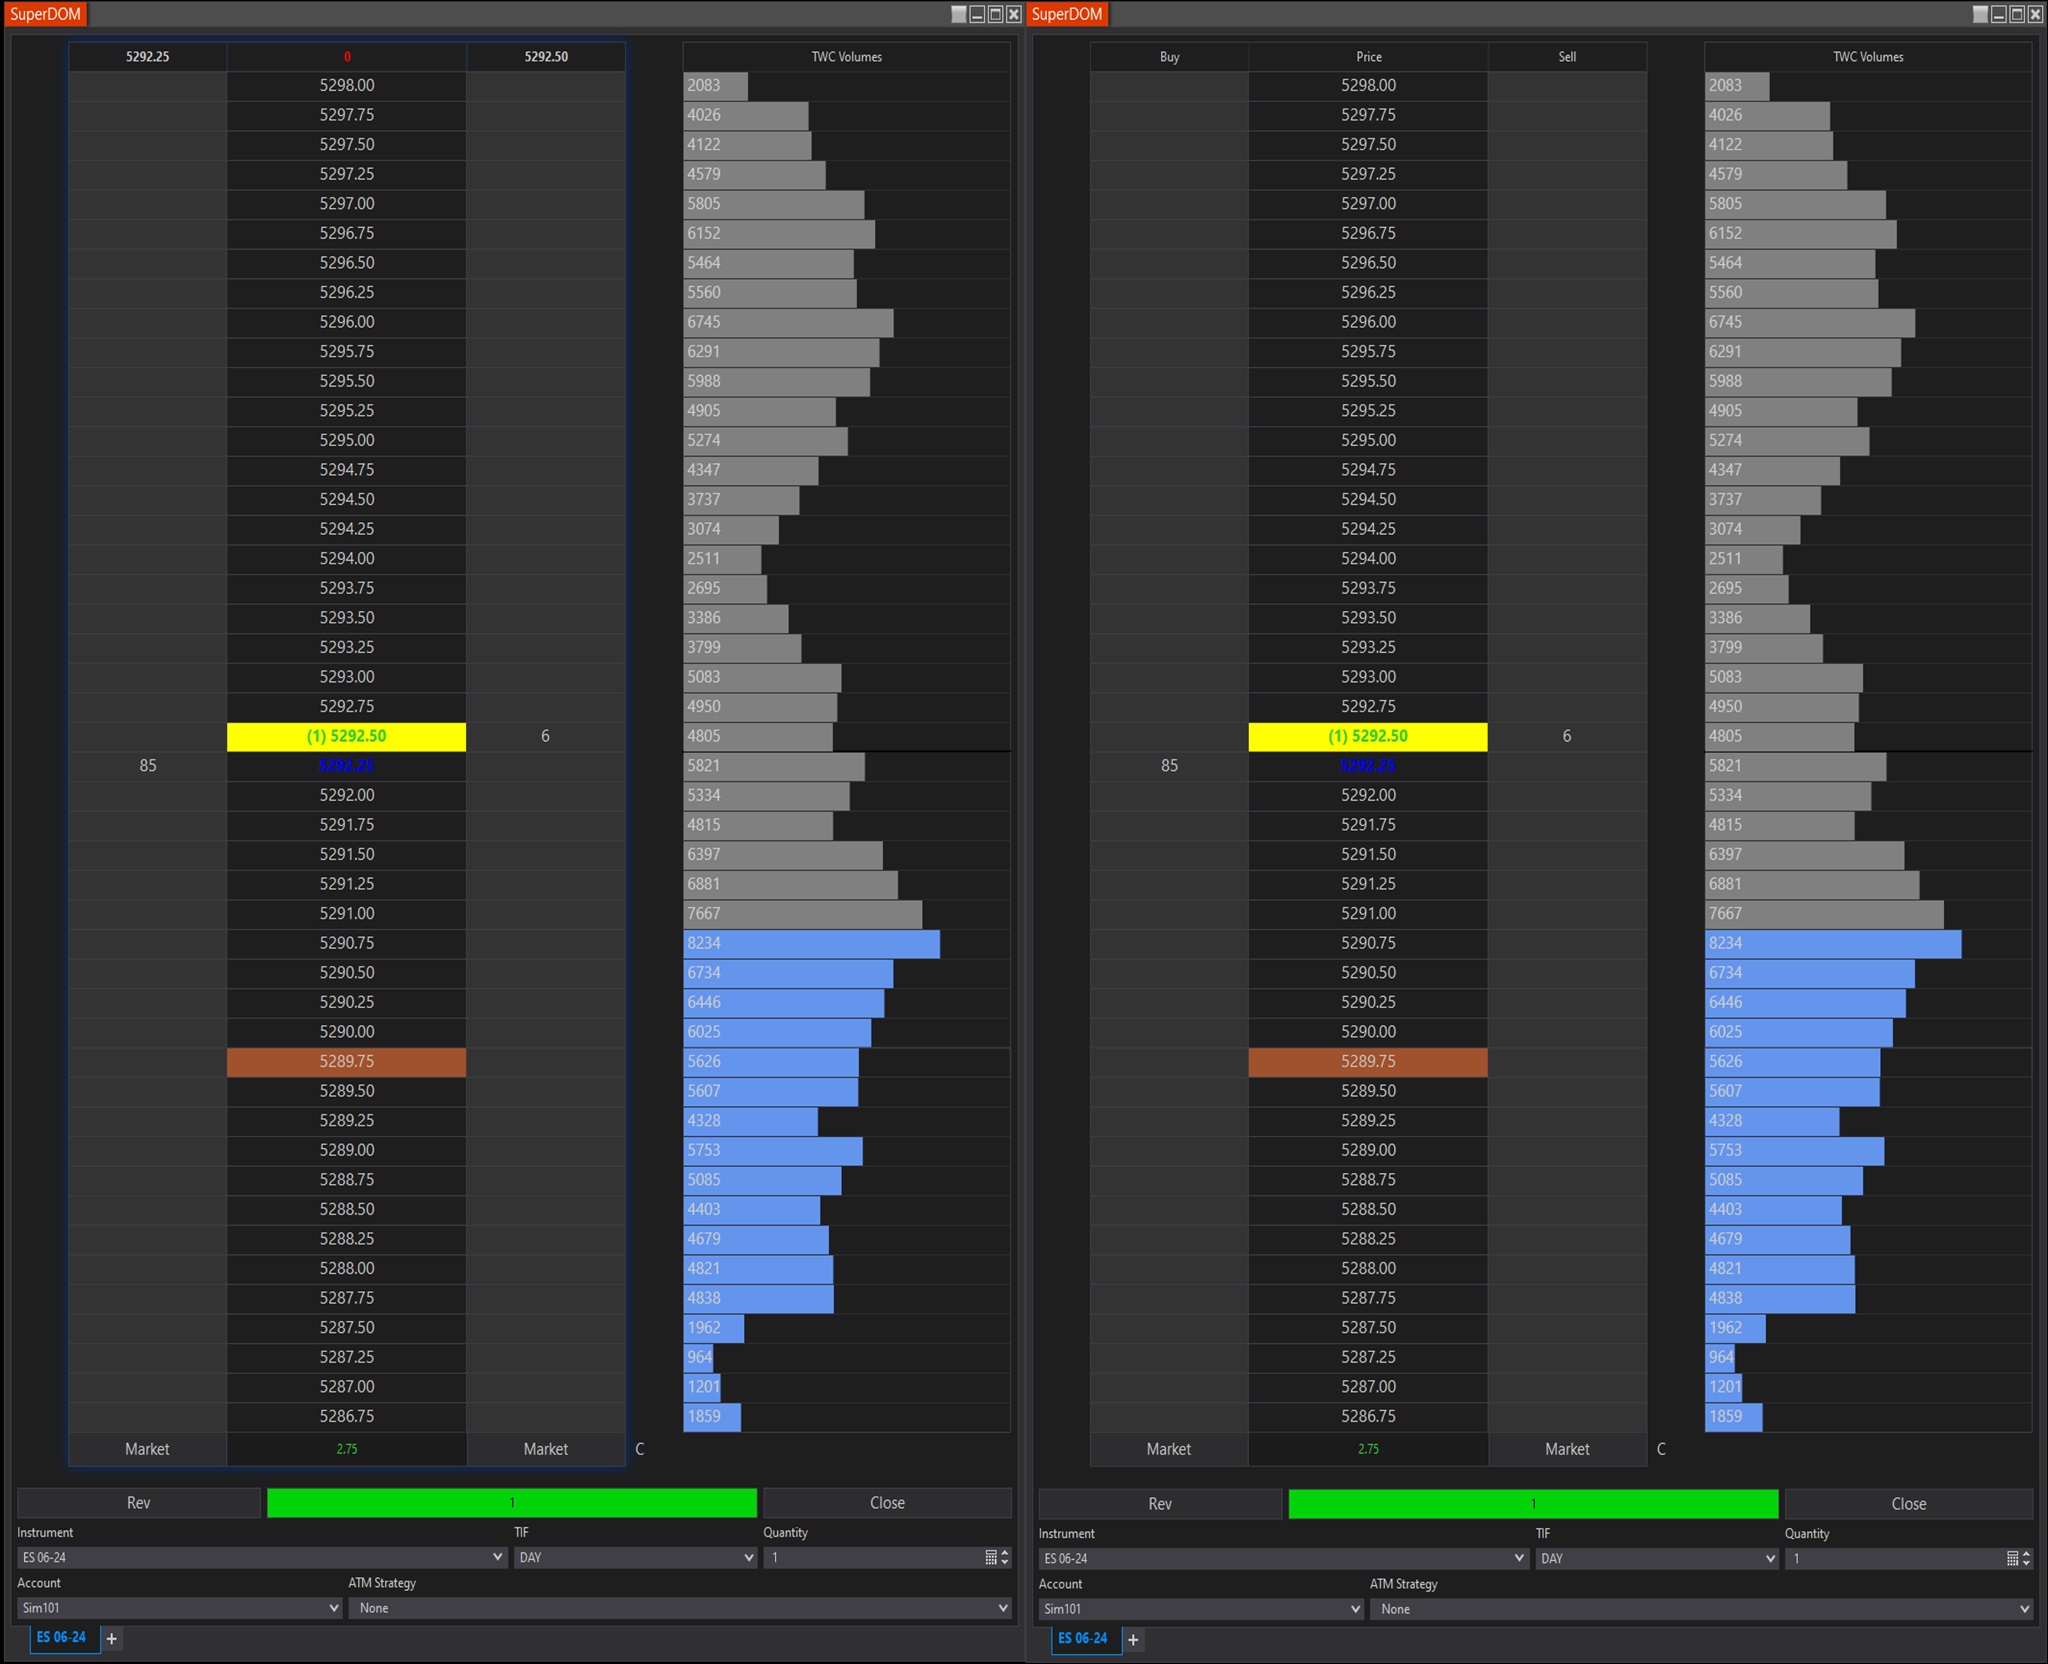
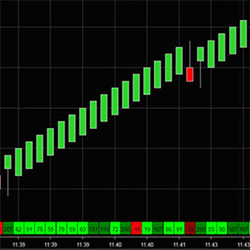
Market Delta Volume Profile is designed to distinguish if buyers or sellers are in control & to see breakdown of volume in each bar. It’s used to identify price reversal areas and look into the price action of each Renko bar to view volume profile, price & monitor order flow.
This platform offers a comprehensive library of trading indicators, tailored specifically for the web version of NinjaTrader and Tradovate. It’s a simple subscription service, giving you the freedom to fine-tune your strategies without the burden of buying multiple tools.
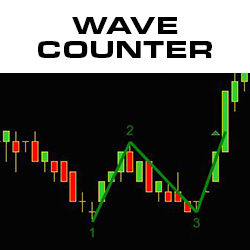
The Wave Counter indicator counts and paints waves in real time, revealing market trends, potential price reversals and no trade zones. The indicator emphasizes wave 3 as the main, informative wave, and creates a "chop box" when there are dueling waves. Download the Wave Counter today.
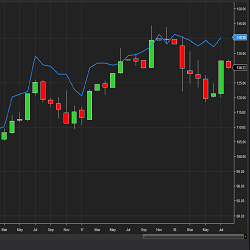
The StockCalcValuation indicator displays a fundamental valuation for the company you are examining. At StockCalc we value 8000 companies each night using 6 valuation models or data points and determine a Weighted Average Valuation from these calculations for display. Get your free trial now!
You can now calculate your recommended trade position size for stocks based on the current market volatility and your risk appetite, in real time. Once you input the “RiskPerTrade” amount, It displays the number of shares in your market analyzer column. Get this powerful risk management tool!
December 2, 2024
Mastering Sideways Markets With Auction Bars and Range Projections
November 19, 2024
Enhancing Your Automated Trading System: Key Insights from Best Pro Trade
November 14, 2024
NinjaTrader New Ecosystem Tools: October 2024 Edition
Enter Email for Updates