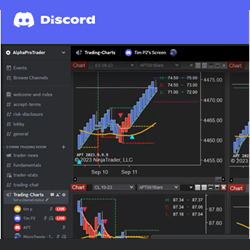
Trading group support and education, live market trading and NinjaTrader 8 add-in for E-mini trading turnkey system: ES, NQ, YM, RTY, CL, GC. Discord trading group for futures NYSE hours. E-mini futures trading, live market trading commentary, charts, mentoring and more.
A powerful self-study program that will help you learn the core principles and implementation of the Hunt Volatility Funnel Method with a total of 18 hours of material, topic by topic, alongside case studies and live trading webinars.
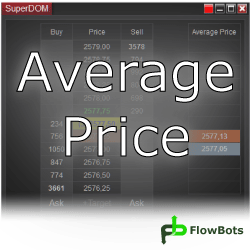
The SuperDOM Average Price Column shows a position average price accumulated since the first order execution. All opened and closed executions from the beginning of the position are used for the calculation. Save time by knowing your current position's average price for all of your past entries!
Education that includes beginner, candlestick analysis, how to place a trade, stair stepping, Fibonacci retracements, Fibonacci extensions and more.
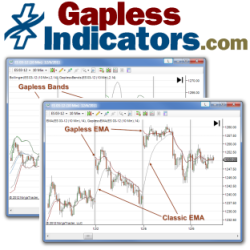
Never worry how an opening price jump or drop affects your favorite classic indicator (MACD, Stochastics, EMA, ATR, etc.). Gapless Indicators are enhanced versions of 15 classic technical indicators that self-adjust in real-time to any opening gap (aka overnight gap).
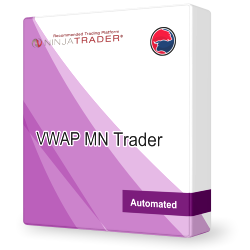
VWAP MNTrader strategy is a fully automated trading system. Trading is based on the VWAP indicator for the daily, weekly and monthly periods on the breakdown test strategy with a filtering system. It has an improved position support system with flexible settings to improve trading consistency.
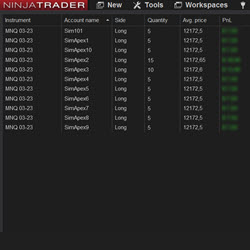
With this tool you can copy your own trades to multiple accounts from the same broker. If you use Propfirms with multiple accounts this is a must have for you. You can trade up to 20 accounts, open orders between different instruments, and have the possibility for an order multiplier.
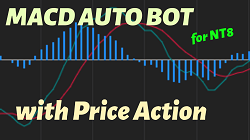
MACD PAT is a strategy using the MACD indicator and this Price Action Trader module. When combined together the system becomes a very efficient and reliable auto strategy. This strategy is easy to understand and manage making ideal for beginners to expert traders.
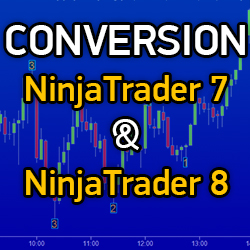
Emet Trading Solutions is a team of experienced programmers focused on trading. They offer strategy and indicator conversion from NinjaTrader 7 to NinjaTrader 8, or from NinjaTrader 8 to NinjaTrader 7. Their services include an individual approach and ongoing technical support. Get a free quote!
A site that hosts a unique platform in Italy that offers you Live Market, Operational Book, Market Ideas, Analysis, Training in just one click. Trading Room LIVE, Operating Log, daily markets watch, tools, tutorial, essential course included, free webinar for subscribed.
December 2, 2024
Mastering Sideways Markets With Auction Bars and Range Projections
November 19, 2024
Enhancing Your Automated Trading System: Key Insights from Best Pro Trade
November 14, 2024
NinjaTrader New Ecosystem Tools: October 2024 Edition
Enter Email for Updates