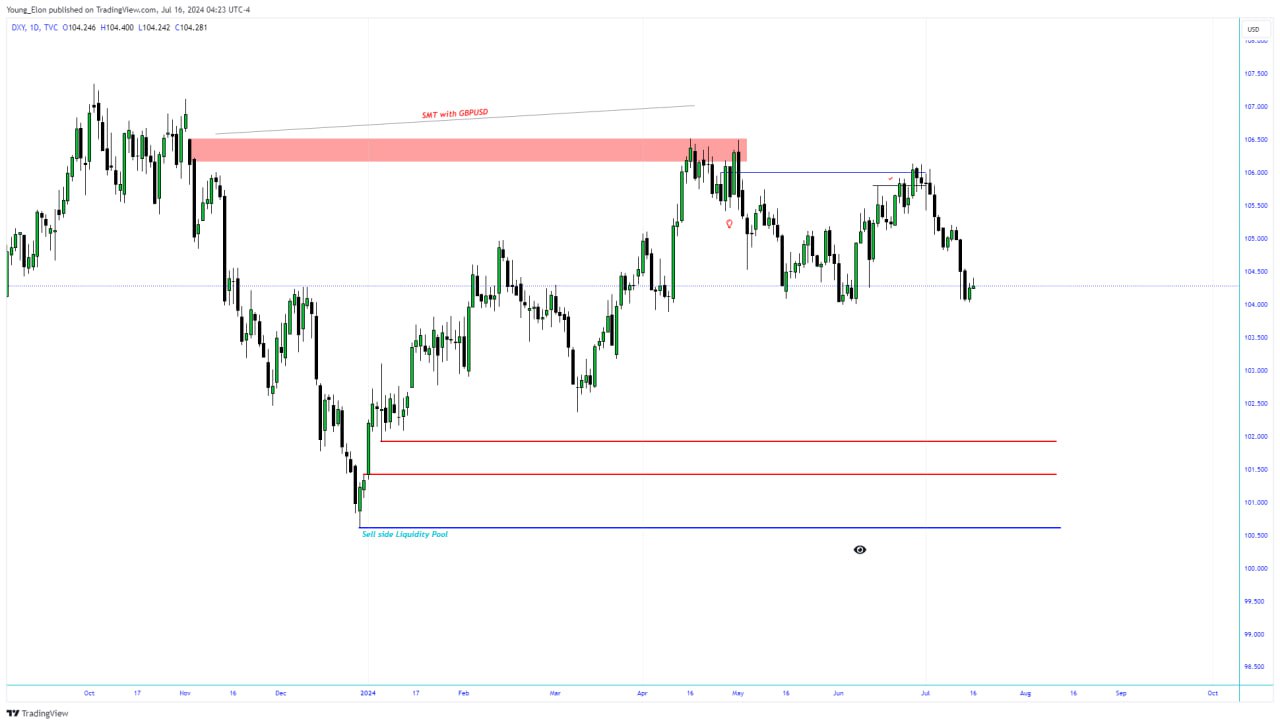
This is a YouTube channel, in which they share the precise models for smart money trading concepts. With the concepts, you can trade like the banks, by following their foot prints. With the models, you are able to see the specific footprints and in return trade like the institutions.
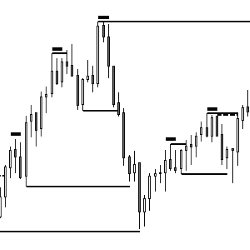
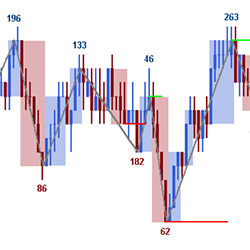
This indicator shows Double Bottoms and Double Tops which are tested by subsequent price action. It shows micro Double Bottoms & micro Double Tops as well. Use it as a discretionary indicator and for automated trading (e.g. BloodHound). Get started with a free 20-day trial today!
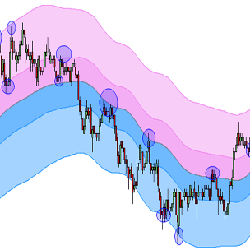
A remarkable price channel, with a proprietary formula that is adaptive to market conditions and reveals dynamic support and resistance levels. TC_NovelChannel paints two colored bands which show a consistent tendency to provide support and resistance to price, for any instrument or time-frame.
The LogikDynamicRange is a unique Range Bar with Dynamic Resizing capabilities. This is done by employing a non-lag range determination technique, continuously adapting the bar size throughout the day, capturing trends while displaying consolidation areas very easily.
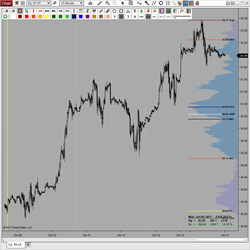
Volume Profile Composite features 7 configurable Profile Durations (including Daily, Weekly, Monthly, Contract, User Defined), 8 Levels of Significance (VPOC, VA’s, VWAP, High/Low/Mid, PClose), 3 Modes of Calculation (bar/min/tick), a profile summary, and simple configuration thru the toolbar icon!
The Epic U-Turn indicator is based on volume & previous price action to confirm that power has switched from buyers to sellers. For intraday or swing trading, these are also known as reversal bars, turnaround bars or engulfing reversal patterns. Strategy supports algo-trading. Download a free trial!
The MAutoFloorCeiling indicator is the culmination of over 2 years of research to determine support / resistance levels automatically. The heart of it utilizes a powerful algorithm based on Wyckoffian concepts of waves, volume, and price levels to gain insight on potential entry points.
chinese
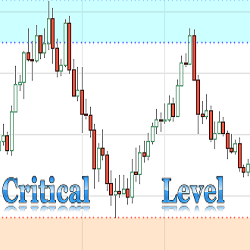
The purpose of this indicator is to automatically plot critical support and resistance levels on a chart. The Critical Support & Resistance Level Indicator comes with customizable alerts and can be added as a Market Analyzer column.
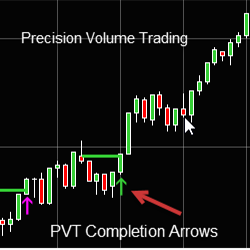
Precision Volume Trading Completions Arrows helps traders determine if the market will move up or down.
December 2, 2024
Mastering Sideways Markets With Auction Bars and Range Projections
November 19, 2024
Enhancing Your Automated Trading System: Key Insights from Best Pro Trade
November 14, 2024
NinjaTrader New Ecosystem Tools: October 2024 Edition
Enter Email for Updates