The Trading Accelerator Mentorship program caters to new and struggling traders trying to find their way. Trading support, troubleshooting, training and live trading sessions to bring traders up to speed on the business of trading.
RTMC MNTrader is a fully automated trading system. Trading is based on Renko strategy using an exponential moving average. Filtering system based on the MACD and TMA Slope indicators. It has an improved position support system with flexible settings that will improve trading consistency.
The EminiScalp Stalker is an automated strategy that is designed to assist traders with the ever-difficult emotion of entering and staying with a trade. The Stalker searches for potential scalping and trend entries throughout the trading session.
Bell R-Delta Alert provides a 360 degree microscopic view of the markets and is particularly designed for Scalpers, Intraday and short term players. The Bell R-Delta features onscreen, audio and email alerts!
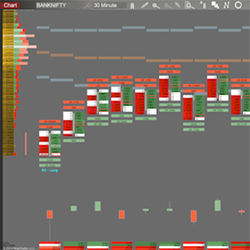
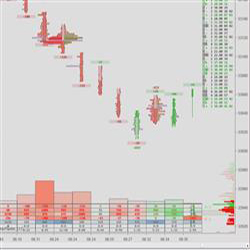
An easy-to-use order flow and volume profiling tool for NinjaTrader 8. The goal is to present order flow in a simple, clear way that also performs well in volatile markets. Numbers are not key here, visuals are. Algo helpers and trade execution assist included. Always evolving! Trial available.
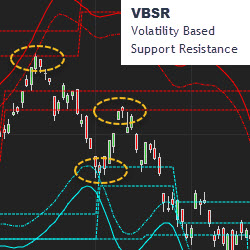
MetaSwing plots the hidden structure of support and resistance in real-time. VBSR (volatility based support resistance) makes this visible in advance, in all timeframes. Markets are non-linear and your tools should be as well. It’s not your father’s TA. Trial MetaSwing.
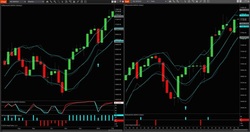
IAStealth signals the entry when the shorter time frame momentum has reversed back in the direction of the trend. More important is to know when the longer time frame momentum is showing signs of reversing. IAStealth alerts the shorter time frame after IAMomentum/IATrend alert the longer time frame.
Turn your ideas into code! We work 1-on-1 with you to understand your needs and engineer a quality software solution that meets them. Automated strategies, indicators, data analytics, portfolio supervision – let us know your needs, we’re here to make it happen. Get in touch with us today!
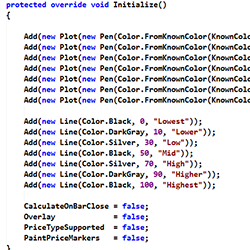
Need a custom indicator, tool or strategy? Integrity-Traders offers a NinjaScript development service aimed at creating tools and indicators with a polished look and feel, precise operation and well documented parameters descriptions. Contact Integrity-Traders today!
Signals are produced by an imbalance of prices between sessions, a principle of markets based in physics. You have the potential of 1 trade per day, automated from start to finish and designed to be monitored in some capacity. Users have full control of strategy parameters.
March 25, 2024
Trading Pullbacks and Reversals: Simplifying a Once Complex Retail Trading Strategy
March 21, 2024
VWAP Indicator: Average Price Shown Based on Price, Volume
March 18, 2024
Trade Copier Strategies: Make Efficiency Work for You When Futures Trading
Enter Email for Updates