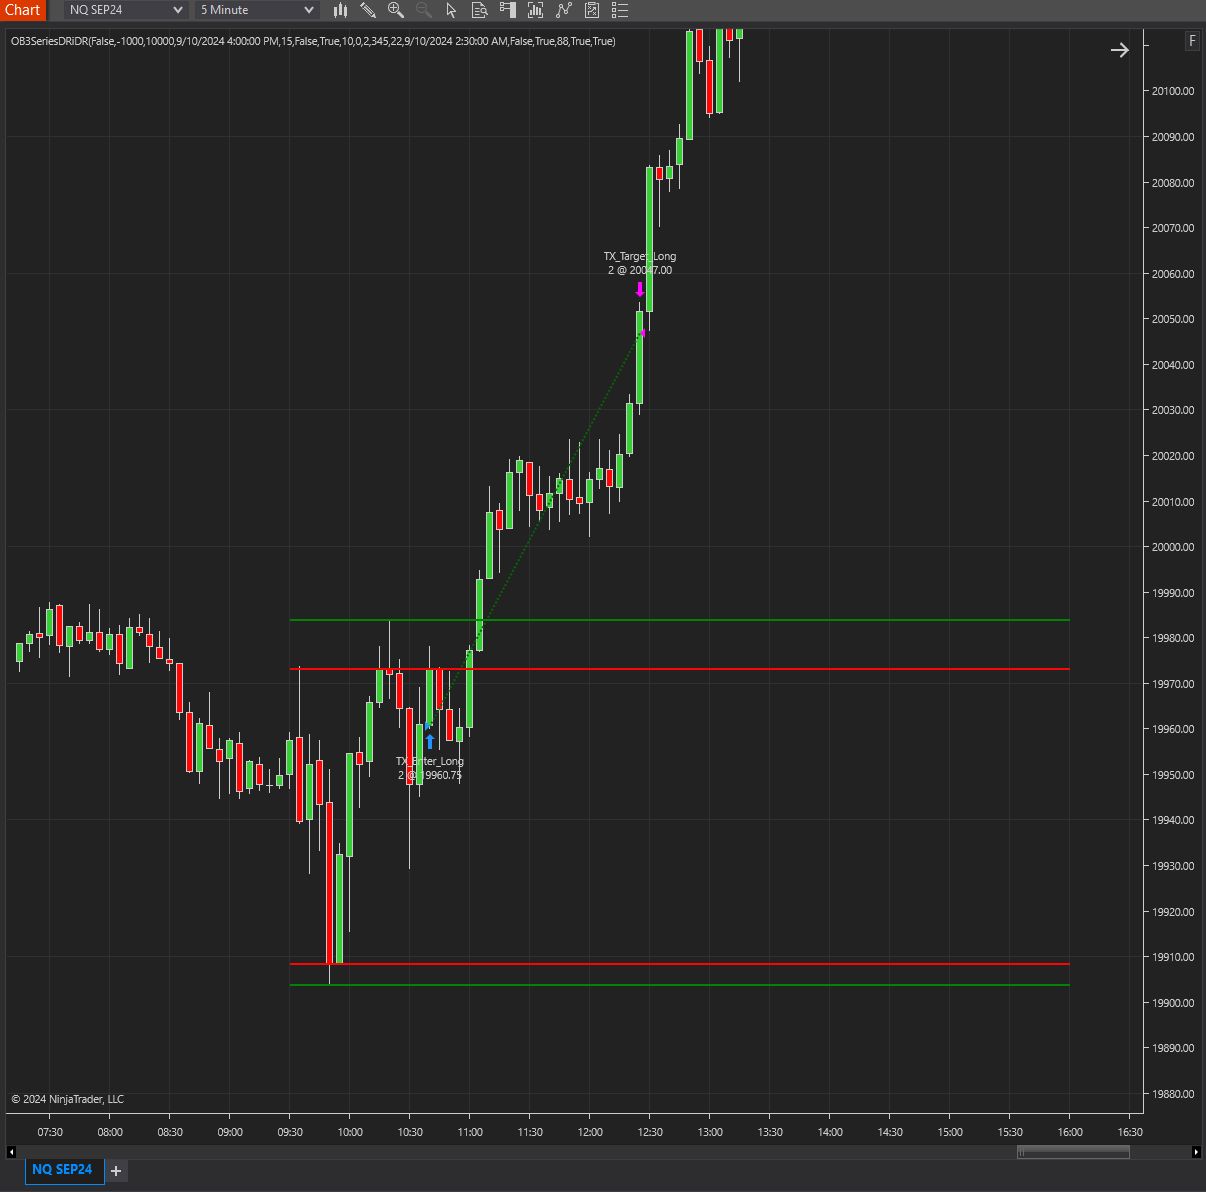
The DR/iDR strategy works by calculating the high, low, and close prices during the critical first hour of trading (9:30–10:30 AM) to determine the Daily Range. It then generates Implied Daily Range levels based on this data, providing clear markers for potential breakout or reversal zones.
Several studies have found a connection between full and new moons and stock market performance. Knowing how and when to time the cycles in trend shifts is centuries old, but new to most traders.
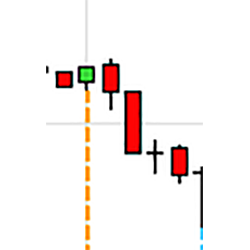
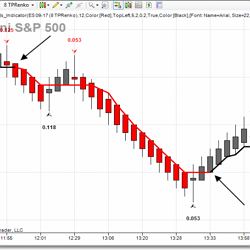
The Price Action Analyzer helps identify and alert price action events when the market enters your reversal area. This tool supports Hidden Gap Bars, Inside/Outside Bars, Up Thrust and Spring, No Demand and No Supply, Effort to Rise, Effort to Fall and Stopping Volume!
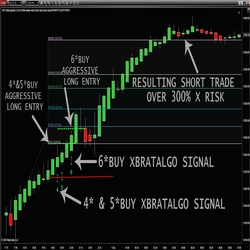
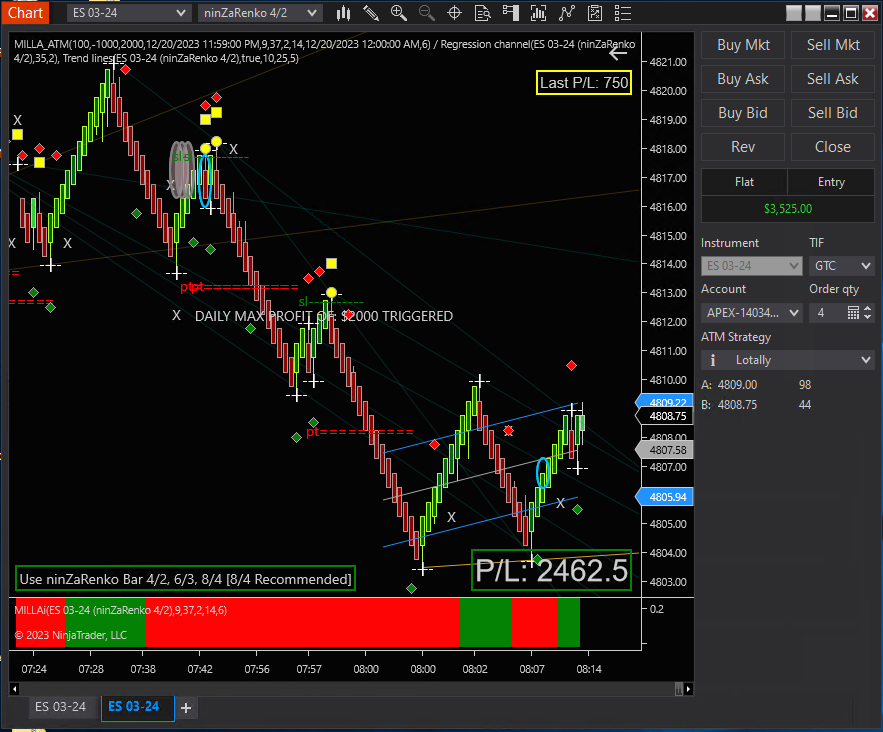
Think of an experienced trader’s brain as a blueprint for a trading algorithm. Then, add the desire to keep charts as clutter-free as possible. Nine decision points defines a 3* trade, 10 decision points makes it a 4* trade, 11 decision points for a 5* trade and 12 decision points for a 6* trade.
Trail a stop automatically behind a wide range of indicators: Price Action, ATR, Bollinger Band, Swing, Parabolic SAR, Donchian Channel, or 9 different Moving Averages. Trailing Stop Expert works on Futures, Forex or Stocks. Grab a 7-day free trial now!
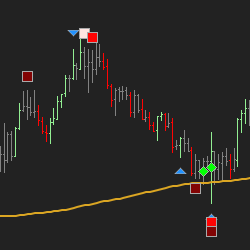
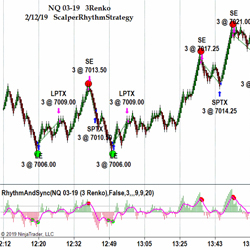
When the ScalperNinja and the Rhythm Indicator generate a signal and both are in sync for a predefined number of bars, the RhythmStrategy enters an order. Both work independent of each other and the Rhythm Indicator can also be used on its own for manual trading.
A simple 3-point system consisting of renko bars and two turning point trend indicators. The system is designed to enter trades late yet see positions through and avoid early exits. Includes fully automated strategy and indicator package. Free 30 day trials are available!
An indicator with automated entry notification along with entry, stop loss and profit target spot included.
Dynamic Market levels calculated by Scalp Radar. The first market level provided by this indicator is the daily, weekly, monthly, and quarterly expected move. Based on the options market, these levels provide crucial insights into the estimated price ranges for popular symbols such as SPY and QQQ.
If you're still guessing what tick speed to use as an intraday trader, stop now, and start using the Tickspeedometer. The indicator instantly reveals the correct tick chart setting for all instruments and timeframes throughout the trading session. So, stop guessing, & start trading with precision!
December 2, 2024
Mastering Sideways Markets With Auction Bars and Range Projections
November 19, 2024
Enhancing Your Automated Trading System: Key Insights from Best Pro Trade
November 14, 2024
NinjaTrader New Ecosystem Tools: October 2024 Edition
Enter Email for Updates