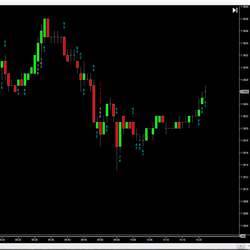
This NinjaTrader indicator is programmed to highlight the big money trades. The numbers are placed under each bar which makes it easy to see where the action/noise is taking place.
Every download will receive a 14-day Free Trial of the app on either Android or Iphone. You will be able to test the technology, analysis, trading signals and everything else at no cost. See how Forex Trading Unlocked can enhance your forex and futures trading. Gain trading consistency!
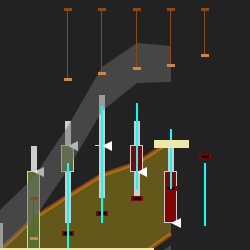
Drummond Geometry unlocks the power of your NinjaTrader platform by revealing the market's hidden structure to you. Drummond Geometry combines short-term moving averages and accurate support/resistance lines, all coordinated on multiple time periods. Trade with confidence!
The IABands are envelopes similar in concept to the popular Bollinger Bands, only far more responsive. The direction and the width of the IABands gives an idea of when a financial instrument is trending versus not trending. The value of any band will very often turn out to be a strong reversal area.
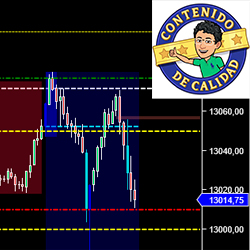
Análisis de mercados americanos una hora antes de la apertura: Futuros de Nasdaq (NQ y MNQ), S&P (ES y MES), Dow Jones (YM y MYM), Russell (RTY y M2K), Petróleo (CL y MCL) y Oro (GC y MGC). Determinación de niveles de compra y venta con Price Action y Smart Money.
Traderistic helps to get rid of fear in trading by looking for signs of fear that can impact a trader’s performance. This tool live-monitors the biggest muscle in the body, the heart. Traders can develop a new level of awareness to increase control and serenity, making trading an enjoyable exercise.
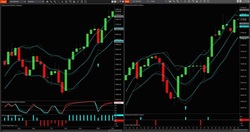
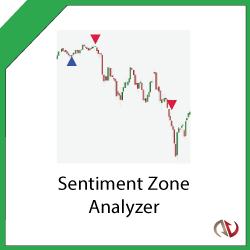
Use the Sentiment Zone Analyzer to measure overall market sentiment to spot trend reversals early! Based on the premise that extremely bullish or bearish tendencies will eventually lead to trend reversals. Dynamically calculates overbought and oversold levels based on previous price action.
This course is designed to get you up and running with strategy design and coding for NinjaTrader 8. It provides the most efficient framework that you can adapt for the architecture of most systems and demonstrates various ways to enter and exit the market using the most standard techniques.
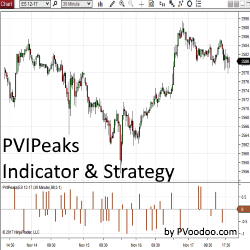
PVIPeaks Indicator and Strategy pinpoints peaks from any standard NinjaTrader indicator and allows traders to use them to generate a signal for an automated strategy. This tool is available exclusively for NinjaTrader 8. Get your free trial today!
Know that you’re an amazing trader but finding the funds to get started is the one thing standing in your way? At UProfitTrader, we can help! Simply choose the size account you’d like, show us what you’ve got through our unique testing process, then start turning your passion into a profession.
December 2, 2024
Mastering Sideways Markets With Auction Bars and Range Projections
November 19, 2024
Enhancing Your Automated Trading System: Key Insights from Best Pro Trade
November 14, 2024
NinjaTrader New Ecosystem Tools: October 2024 Edition
Enter Email for Updates