Let us help you automate your indicator or strategy! Our custom programming service provides automation for indicators and automated strategies.
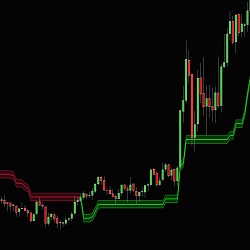
Introducing Friend Zone, a professional market indicator designed to identify mean reversion opportunities with precision. By analyzing price movements and historical data, Friend Zone intelligently detects when a security has deviated significantly from its average value.
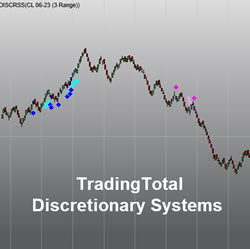
TradingTotal Discretionary Systems replicates several popular TradingTotal automated strategies entry rules for manual trading modality for future instruments.
Providing a monthly service to this trading algorithm, SpartanBot. It is a trading algorithm that focuses on momentum trading, and follows a good risk management.
Enhanced Decision-Making; Trading Awareness/Behavior. Basic Training accelerates improvement by strengthening behaviors causing the brain to filter, process, and apply information most effectively. Psychology, sociology and neuroscience are integrated to keep decisions ahead of price movement.
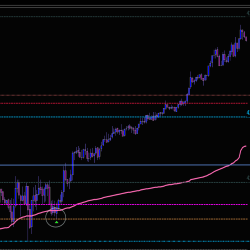
A modified 'Previous-Day OHLC' that includes JTFutures' most powerful level, the Holy Orange Power Level. This level prints every morning and is plotted based on overnight price action.
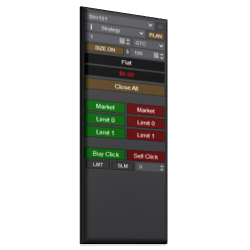
The Essential Chart Trader Tools is a starter pack for the Enhanced Chart Trader. It is full of features to help traders focus on decision making, remove stress and minimize mistakes. The Essential Chart Trader Tools can be added to any chart window in NinjaTrader.
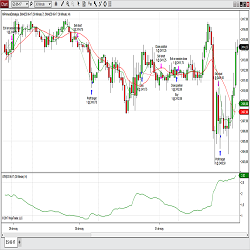
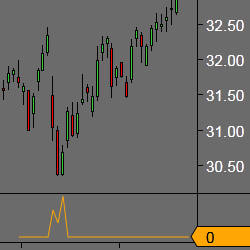
Precision Divergence Finder is designed to find bullish divergences in Demand Index readings in real time with no delay or re-painting. It can often pinpoint precise market bottoms and using this product can give you the insight needed to increase the chances of finding the exact market low point.
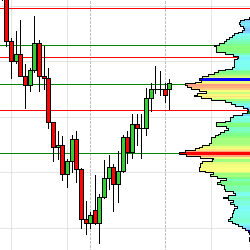
GomMPPro is a high-performance tick-based volume profiler. It offers many data points such as: HVN/LVN, POC, VWAP & VA. Additionally, it features customizable hotkeys allowing traders to quickly toggle between favorite settings. Free 2-week trial available.
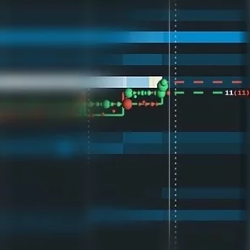
A fantastic way of using the Quotes Delta setting on Bookmap.com to identify whether important support and liquidity levels will hold or break, the Sweep Show setup has helped Nic understand when it was time to fade a move or go with it in E-mini S&P 500 futures.
December 2, 2024
Mastering Sideways Markets With Auction Bars and Range Projections
November 19, 2024
Enhancing Your Automated Trading System: Key Insights from Best Pro Trade
November 14, 2024
NinjaTrader New Ecosystem Tools: October 2024 Edition
Enter Email for Updates