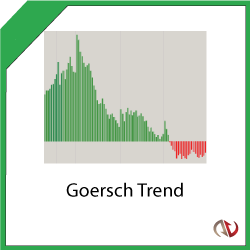
Confirm trend direction with this unique & proprietary indicator. It can be combined with any trading strategy to provide extra confirmation & is ideal for validating your open trades. It works out-of-the-box with no parametrization needed & detects Up and Down trends.
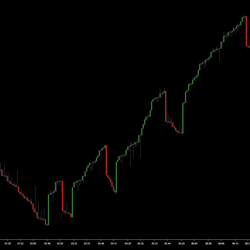
The LogikDeltaRenko is a unique Cumulative Delta based bartype with Renko like trend and reversal attributes. It fuses market price with buyer vs seller volume, granting maximum ability to maintain the underlying market sentiment while minimizing volume based reversal lag.
Try our fully-functional, ready-to-use automated trading strategy for NinjaTrader 8 at no cost for 14 days. Designed for the futures market, it has been thoroughly backtested, needs no adjustments, & is suitable for Micro/Mini markets. Full support and templates are included during your free trial.
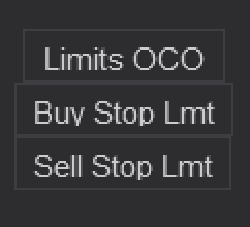
Bars Edge Trader Button and OCO Timer pack for NinjaTrader 8. An easy fast solution to apply Limit Orders to your Chart Trader. Included are three timers for adding OCO Limits entries throughout the day to catch a news cycles semi-automatically.
In this course you will learn how to trade the following chart patterns: Trendline strategies, candlestick patterns, chart patterns, Elliot Wave Theory, harmonic patterns, risk management, trading plan, trading psychology and more.
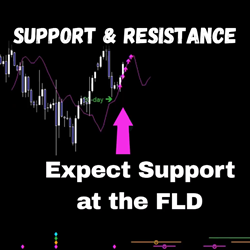
Perform an expert Hurst cycle analysis on any instrument/timeframe chart, and gain insight into hidden levels of support & resistance with accurate targets. Interactions between price & the Future Line of Demarcation (FLD) are identified for you, enabling anticipation of price action ahead of time.
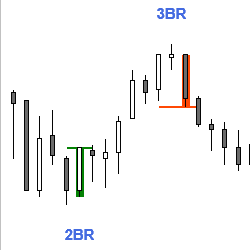
This indicator identifies 10 different signal bars or patterns for possible reversals by examining bar features and relation to prior bars. It can be used as a discretionary indicator or for automated (e.g. BloodHound) trading. Get started with a free 20-day trial today!
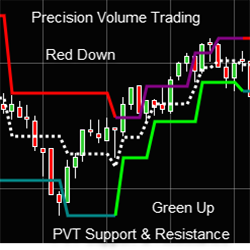
Precision Volume Trading Support & Resistance measures each swing point for traders to know where buyers and sellers are.
The Volume Profile Learning Pack includes 44 in-depth training videos, 15 hours of video content and hundreds of real trade examples, including forex, futures, indexes, and stocks. It also includes custom-built Volume Profile indicators for NinjaTrader 8.
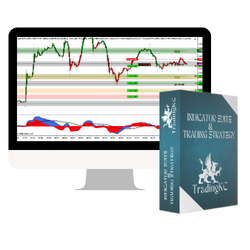
Simplify your trading with my strategy: trend, price action, support/resistance and momentum. Green/red bars indicate trend, custom ExCon indicator manages setups, pivots show support/resistance and MACD ties it all together. Clear entries, take profits and exits with simple rules for engagement.
December 2, 2024
Mastering Sideways Markets With Auction Bars and Range Projections
November 19, 2024
Enhancing Your Automated Trading System: Key Insights from Best Pro Trade
November 14, 2024
NinjaTrader New Ecosystem Tools: October 2024 Edition
Enter Email for Updates