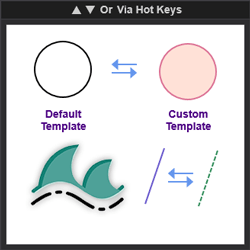
This indicator allows the user to switch a draw object's template on the fly without having to dig through various menus. This increases application functionality and user charting efficiency.
Learn how to manage 300k from FTMO through this detailed price action classes as well as live sessions. Learn the raw emotions involved in trading and how to manage those emotions.
OTM Volume Profile is essential to understand the auction behavior and find key price reaction zones, such as the VPO, high and low value area. This profile preserves and allows to visualize these levels historically, which distinguishes it from static profiles.
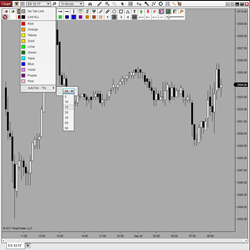
The market efficiency is an oscillator-based gauge which monitors bid and offer information in an adaptive sequence. By monitoring such action, the user will be able to determine efficient (directional) or inefficient (turning) price action.
Auto Tab adds a Tab Link Selector to the top left portion of every Dom & Chart window. Simply click on the tab of any window, and all other windows (linked by color) will also change to that same tab! Simulate multiple workspaces with tabs and enable automatic sequencing with a configurable timer.
Maximize trading with Modena Wick Trader, offering total control, dynamic market adaptation and custom settings for optimal efficiency. Automation to the next level!
CrossTrade connects TradingView to NinjaTrader. Easily automate your strategies on TradingView and execute them directly on NinjaTrader desktop.
Become a full access member to all of thei exciting services. Membership includes: Trade room access, software activation for up two computers, and thei Daily Market Movers trade reports.
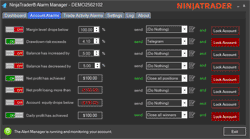
The NinjaTrader Risk Manager is a personal trading assistant for your PC, designed to perform various automated tasks. These include setting alarms for account and trade activities, initiating account lock-outs, and alerting you when your account is at risk.
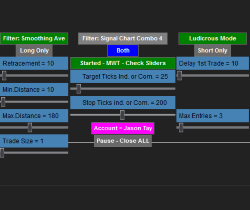
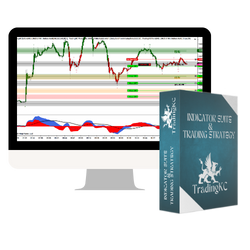
Simplify your trading with my strategy: trend, price action, support/resistance and momentum. Green/red bars indicate trend, custom ExCon indicator manages setups, pivots show support/resistance and MACD ties it all together. Clear entries, take profits and exits with simple rules for engagement.
December 2, 2024
Mastering Sideways Markets With Auction Bars and Range Projections
November 19, 2024
Enhancing Your Automated Trading System: Key Insights from Best Pro Trade
November 14, 2024
NinjaTrader New Ecosystem Tools: October 2024 Edition
Enter Email for Updates