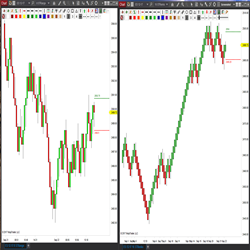
STBars are Structural Trading’s custom range and renko bars which include the STRangemanker, a tool identifying for support, resistance and trend bias. The STBars are available in NinjaTrader 7 and NinjaTrader 8. Learn more!
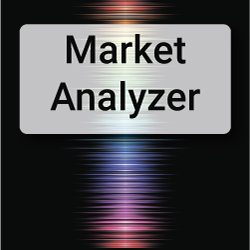
Market Analyzer 96 Trade Systems is a framework of 96 easy-to-use trade systems to test market conditions. With this course you will be able to extend the provided framework and use it as a powerful tool for building trade systems.
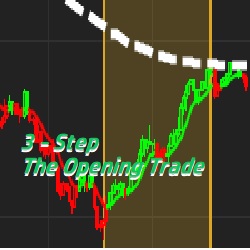
The 3 Step Indicator and Workspace package from The Opening Trade combines three basic elements into a simple Red vs Green color coded, Mean Reversion Discretionary System. Price Action, Trend Strength and Supply and Demand are what drive this 3 Step System.
Use the experience of a quantitative trading system professional to help design, test, improve or optimize your trading strategy. Get a complete system analysis to have the confidence that your strategy performs exactly how it was designed to.
A powerful self-study program that will help you learn the core principles and implementation of the Hunt Volatility Funnel Method with a total of 18 hours of material, topic by topic, alongside case studies and live trading webinars.
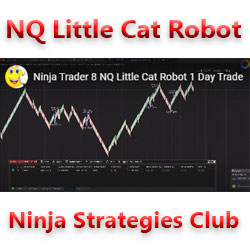
A slow but efficient robot for NinjaTrader 8. It only works on NASDAQ. Take-profit at 13 ticks; stop-loss at 18 ticks. If you want, you can change the take-profit and stop-loss settings.
Custom Development Services are tailored for NinjaTrader users, offering bespoke solutions across markets. They provide real-time cryptocurrency data integration, custom indicators, strategies, and add-ons to optimize trading performance and profitability.
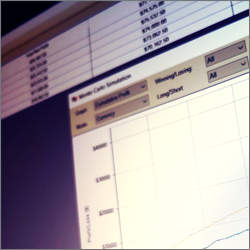
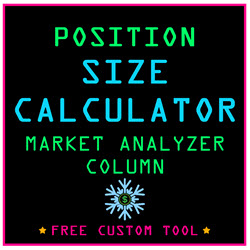
You can now calculate your recommended trade position size for stocks based on the current market volatility and your risk appetite, in real time. Once you input the “RiskPerTrade” amount, It displays the number of shares in your market analyzer column. Get this powerful risk management tool!
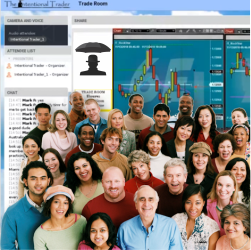
Day trading six futures instruments every day from 9am until 12pm Eastern time. Watch the Intentional Trader system in action in real time. Listen to a trade room moderator call out trades before entering them. They have been trading the same system and indicators since 2009!
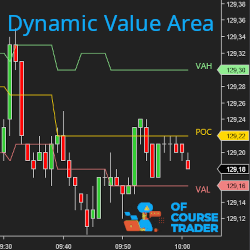
The Dynamic Value Area allows you to visualize in real time the evolution of the POC, VAL, VAH levels corresponding to the most traded value area. It also gives you historical levels. Its NinjaScript API will allow you to integrate the value area into your own indicators and strategies.
December 2, 2024
Mastering Sideways Markets With Auction Bars and Range Projections
November 19, 2024
Enhancing Your Automated Trading System: Key Insights from Best Pro Trade
November 14, 2024
NinjaTrader New Ecosystem Tools: October 2024 Edition
Enter Email for Updates