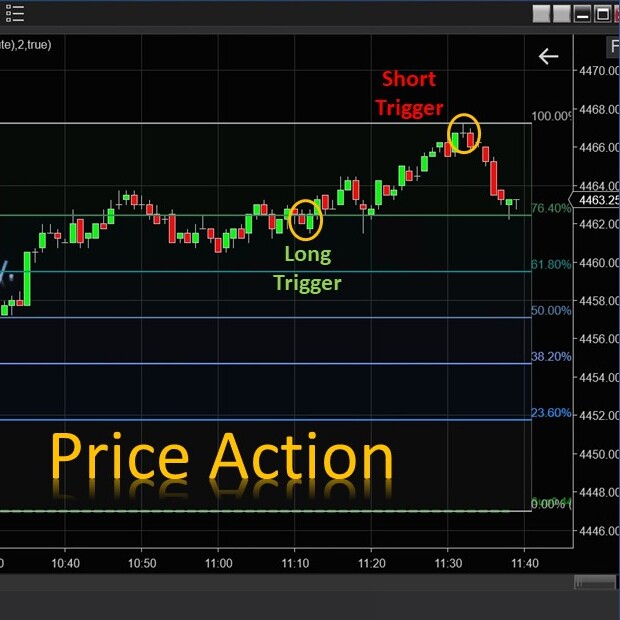
The E.G. Price Action is automatically integrated with the E.G. Trigger Point presented on your chart to generate short and long signals for you. It recognizes Price Action opportunities and generates arrows presented on your chart and sound notifications.
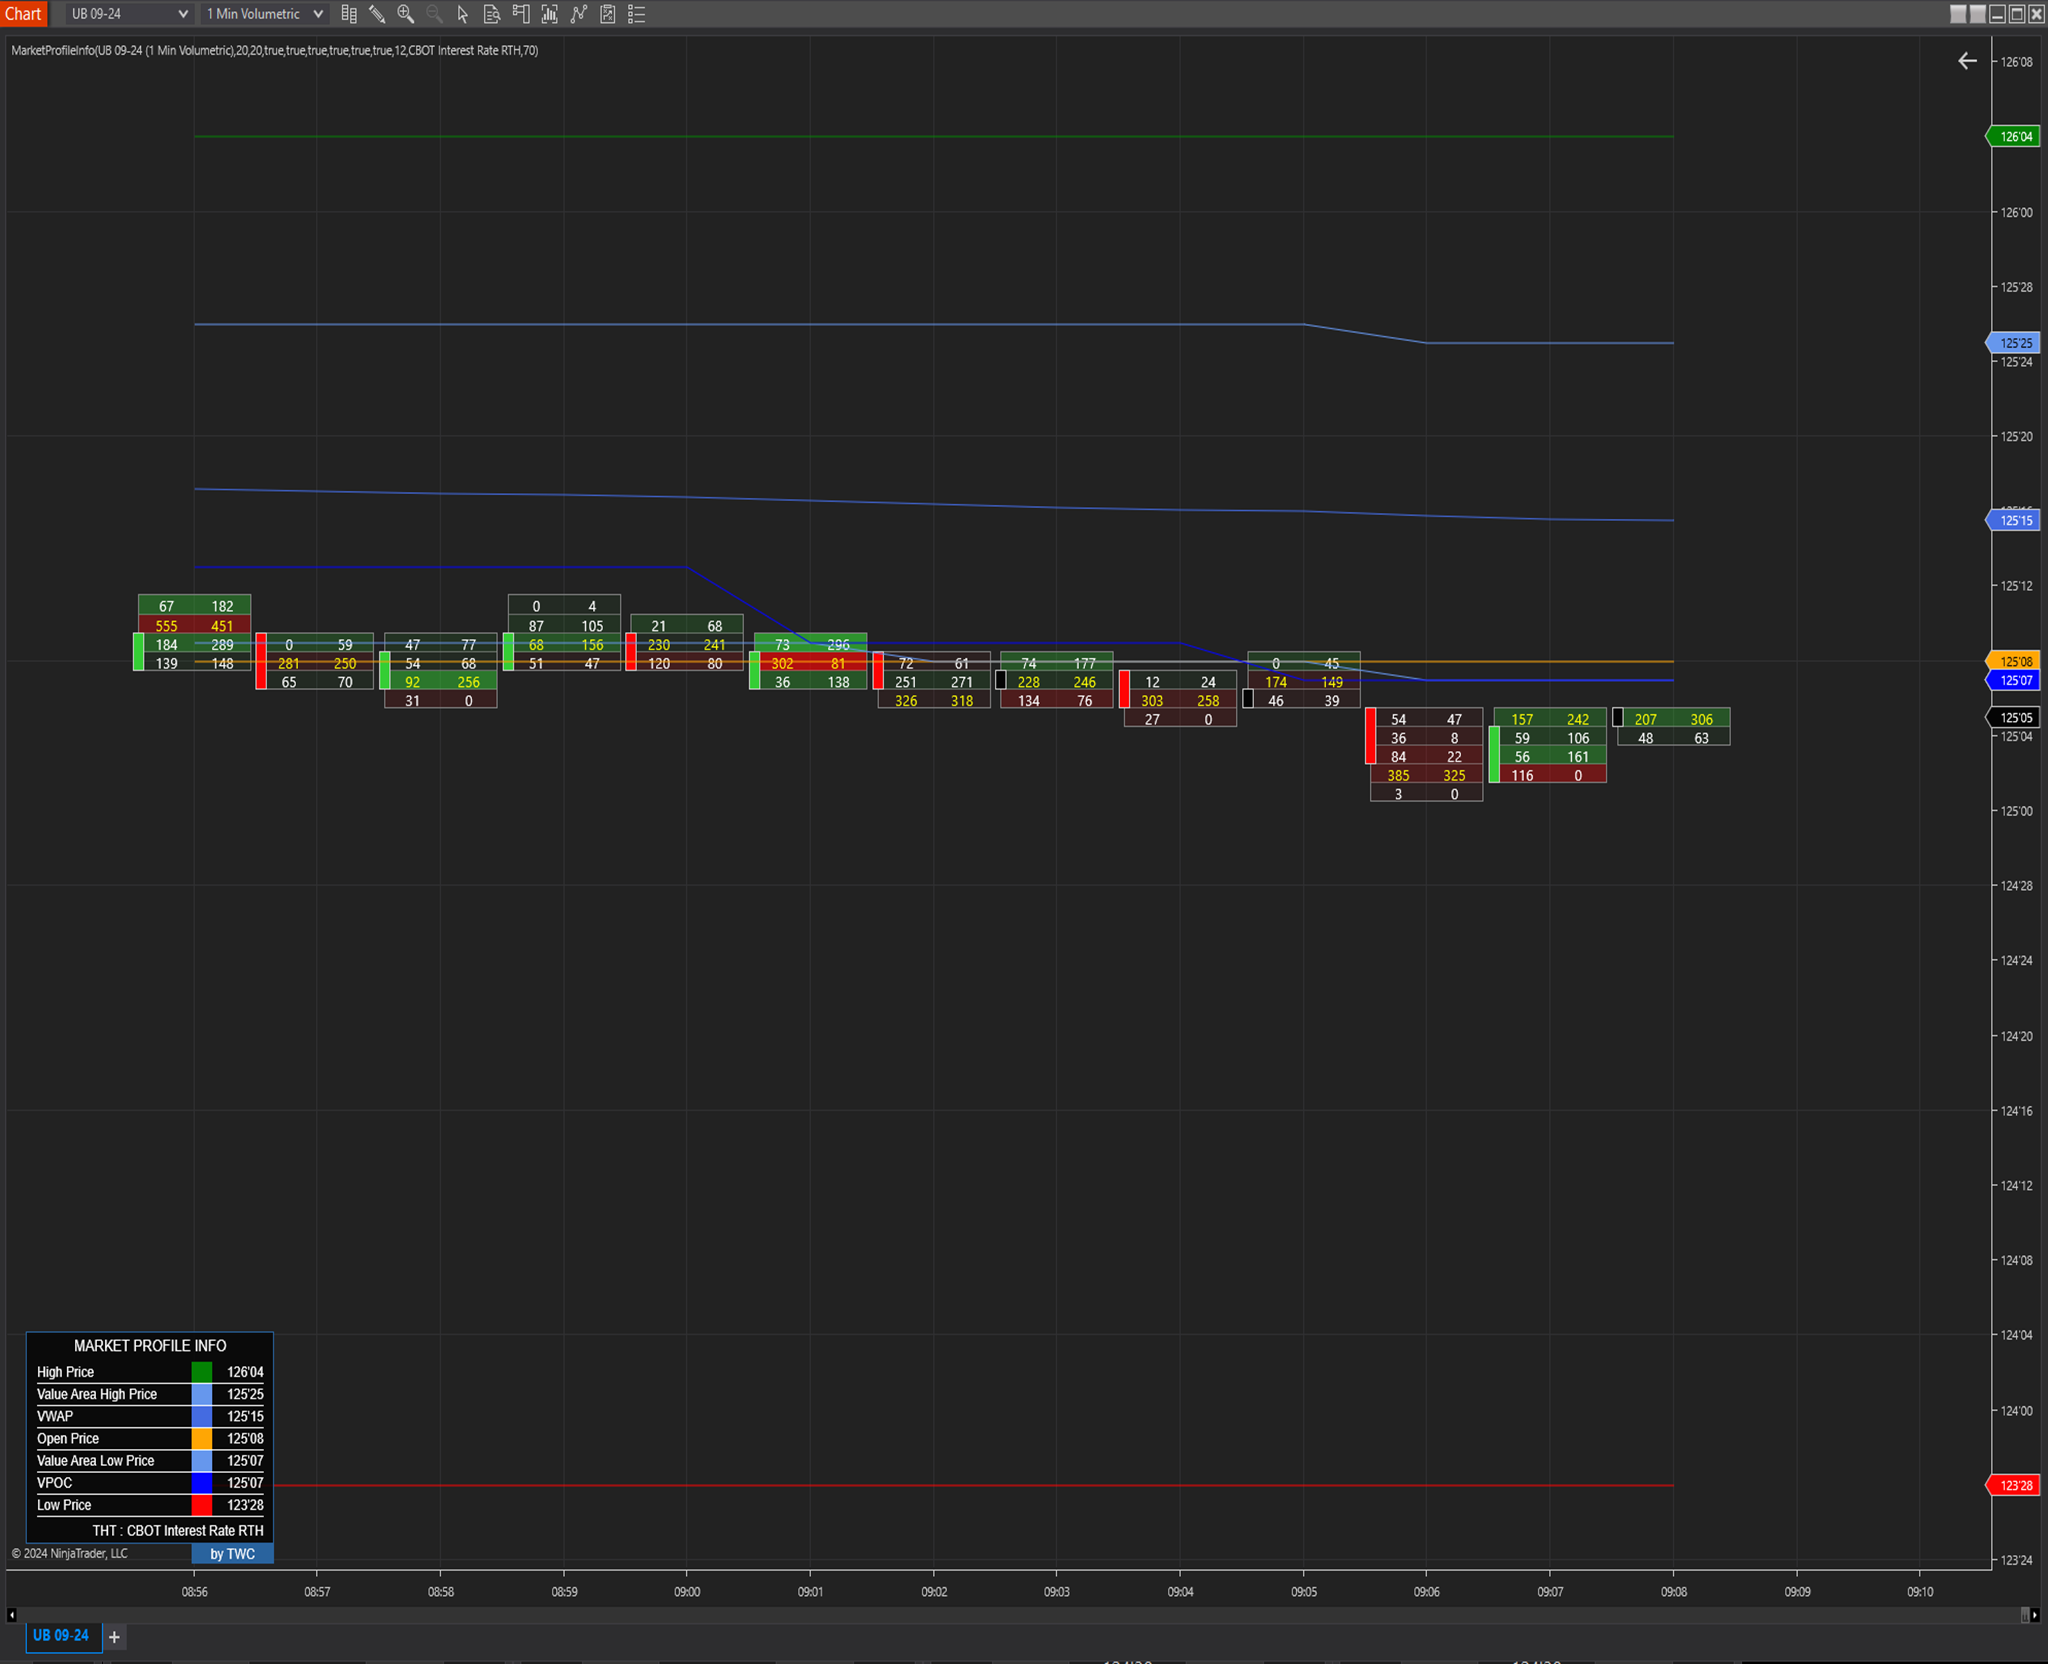
TWC Market Profile Info provides key points on the market profile that are constantly updated in real-time, including the high price of the day, value area high, volume Point of Control (POC), Volume Weighted Average Price (VWAP), value area low, and the low price of the day.
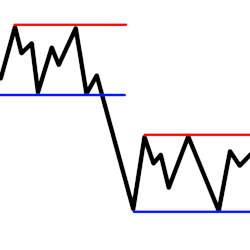
Created to help aid momentum-style charting in finding support and resistance lines. It was specifically made for the ES when plotted with tick bars. This tool may help cut down on chart preparation time or get your chart caught back up if busy multi-tasking.
By focusing on just a few candles, Rev^Out Scalping generates ultra-fast signals that are perfectly suited to scalping. Unlike other indicators that require a certain price range to detect trend or zone, Rev^Out Scalping operates like a miniature trading strategy.
The Session Delta Pivot monitors the aggressive auction participants within a given session. By mapping this type of activity, the user can gauge the potential location for initiative activity as well as develop an understanding of directional day types.
The Visualized Trader helps make trade signals easy to see by measuring 5 uncorrelated energies of money flow. When they are all bullish or all bearish at the same time it plots a simple red or green box on your chart, eliminating the need to clutter your chart with a lot of indicators.
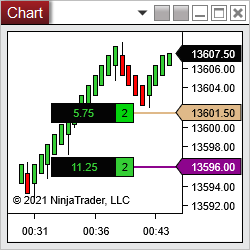
The Breakeven Price indicator shows the breakeven price as a graphical display directly on the chart. It is a must-have for scalpers to scale in/out of positions and keep track of PNL. SuperDOM/Market Analyzer PNL columns & an indicator with a dynamic stop loss order are included. 7-day free trial.
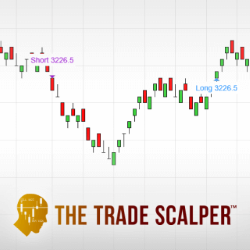
Use the Trade Scalper to pinpoint the exact moment you should place a scalping trade. What is scalping? Fast, in & out trading - multiple times per day. Included are both video and live training.
Channel VA MNTrader is a fully automated trading system. Trading is based on Renko strategy using a Keltner Channels indicator. The filtration system is based on the ADXVMA & the MACD indicator. It has an improved position support system with flexible settings that will improve trading consistency.
This 25+ Chapter Price Action Course plus 4 one-on-one hour long help sessions are designed to address trading hurdles you may be facing. This Couse Includes access to VIP discord, daily morning livestream, lifetime access to the course, and more!
December 2, 2024
Mastering Sideways Markets With Auction Bars and Range Projections
November 19, 2024
Enhancing Your Automated Trading System: Key Insights from Best Pro Trade
November 14, 2024
NinjaTrader New Ecosystem Tools: October 2024 Edition
Enter Email for Updates