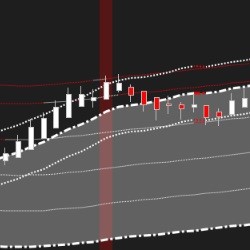
The Linear Regression Trend Lines Indicator dynamically balances the trend on your chart on all time frames. This indicator is built from several linear regression indicators and modified Keltner Channels. Set up to five offset multiplier levels for targets or reversals.
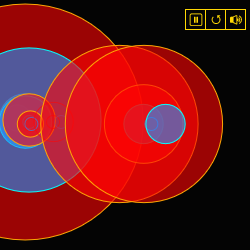
Hear, see and feel the market! A multi-sensory, audio-visual experience of reconstructed trades being executed at every moment. It uses high-performance audio processing technology and an uncluttered visual representation of each trade to give a sense of the pace and size hitting the tape.
Q-BarNetDelta indicator shows the net delta above and below the bar, showing the net difference between buying and selling activity during that time.
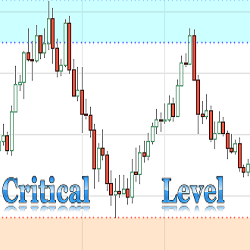
The purpose of this indicator is to automatically plot critical support and resistance levels on a chart. The Critical Support & Resistance Level Indicator comes with customizable alerts and can be added as a Market Analyzer column.
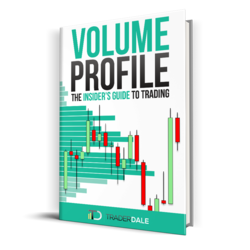
Learn how Volume Profile works and use it to track big financial institutions who move and manipulate the markets. Learn my most favorite Volume Profile trading strategies. This book is written in poignant way with many illustrations and real trade examples.
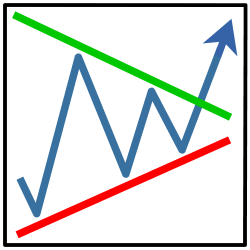
Take trendline trading to a new level with the TrendlineProTrader, developed with your favorite trendline tactics including: horizontal, diagonal, channel OCO, and breakout-pullback. It includes automated trade management and traders can use their own indicators. See TrendlineProTrader in action!
The Volume Profile Learning Pack includes 44 in-depth training videos, 15 hours of video content and hundreds of real trade examples, including forex, futures, indexes, and stocks. It also includes custom-built Volume Profile indicators for NinjaTrader 8.
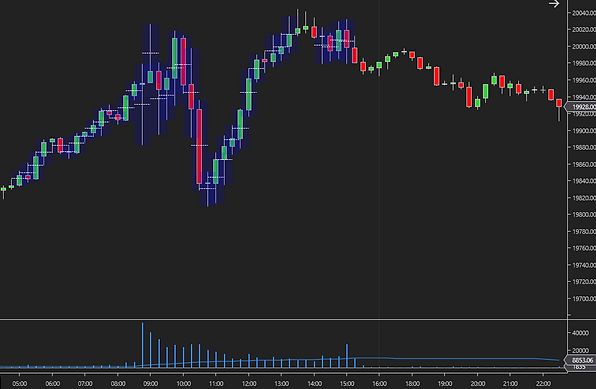
Elevate your trading strategy with the ATS Average Volume Pro indicator. This powerful tool showcases average volume with a customizable Simple Moving Average (SMA) and highlights each bar with above-average volume, making it easier for you to spot significant market moves.
The Quantum Dynamic Volatility indicator paints volatility as price action unfolds - no more guesswork, no more nasty shocks. Watch and wait, then trade with this safety-first indicator!
This tool uses price action, trend and momentum to identify price zones (TrapZones) and price bars (TrapBars) where traders can get trapped in the market. Trade good setups while avoiding bad trades e.g. FOMO, catching a falling knife, or fighting the trend, using automated technical analysis!
December 2, 2024
Mastering Sideways Markets With Auction Bars and Range Projections
November 19, 2024
Enhancing Your Automated Trading System: Key Insights from Best Pro Trade
November 14, 2024
NinjaTrader New Ecosystem Tools: October 2024 Edition
Enter Email for Updates