EPyFBarsType is a tick-based bar, unlike time-based bars such as regular Japanese candles. These bars are one of the main components of our system, due to the objectivity they provide for technical analysis. This bar type helps in identifying market moves and avoiding choppy areas.
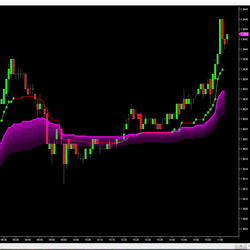
The world’s first self-optimizing SuperTrend indicator. It uses spearhead third-generation scanning to identify actionable signals. Performance metrics like profit factor and number of winners are displayed on the chart to determine potential results.
Anchored VWAP: A dynamic tool for trading strategies. Coding friendly: One of the standout features of the Anchored VWAP is its coding friendliness. Users can seamlessly integrate it into the code of any NinjaTrader strategy, allowing for easy implementation and customization.
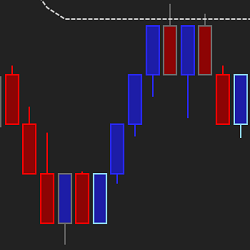
Track volume profile in three timescales easily! Optimal Vision analyses point of control and value area breakouts in three rolling lookback periods of your choice and color-codes your bars by strength of signal. A simple way to bring dynamic volume profile to your trading! Strategy compatible.
DTB River is an implementation of DTB Waves on non-time based charts and the results are plotted on time-based charts. It provides an added layer of noise filtering for waves. During the consolidation phase DTB River flattens out.
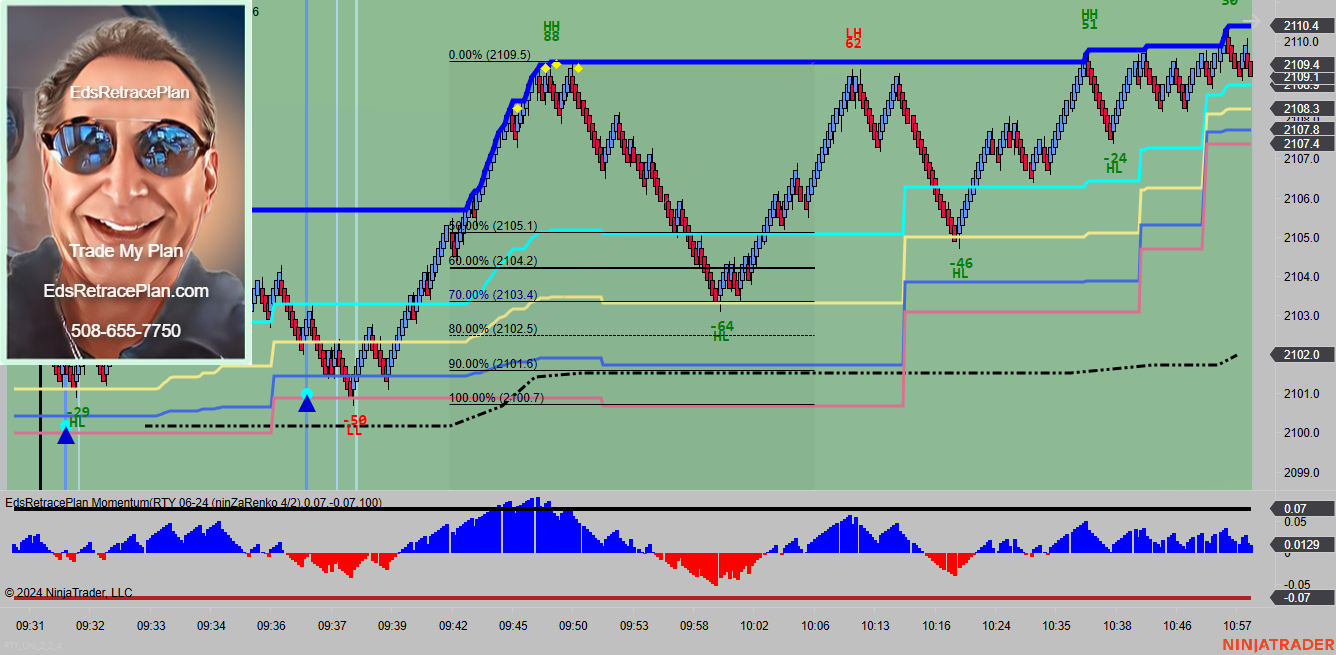
EdsRetracePlan, the innovative system that provides specific day trading signals for ES, YM, RTY, NQ, CL and GC, is now broadcasting live charts to the EdsRetracePlan YouTube channel, daily from 9:00AM to 11:00 EST. For the YouTube URL to this daily show please send an email to [email protected].
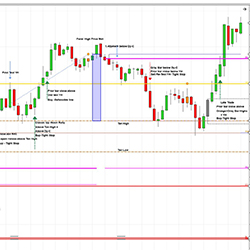
One-stop software for beginner & advanced traders. Proprietary intra-day structure & logic. Advanced time & price signals, custom built for ES, NQ & RTY. The markets opened 100 years ago with the same day timespan as today. See a NinjaTrader webinar free at DMIC2059.com. Use code NTW for a discount.
The Candlestick Express Class is the simple way to learn candlestick patterns and strategies. Traders quickly learn to combine candlesticks, Western technical signals, and trade management strategies. These techniques are useful in Forex or any other market. Get instant access when you register!
Get precious info to start your trading week! Focused 100% in E-mini S&P500 Futures and based in a mix of technical analysis with order flow tools, the newsletter presents possible trading scenarios for the week, highlighting important regions. Sign up now for FREE!
Earl's ultra-configurable HAMA indicator not only smooths out price data, but it excels at helping you spot divergences and leading momentum swings with an "RSI Filter" setting. Trade with more confidence and less hesitation with the included Trend Trigger indicator to help time your entries.
December 2, 2024
Mastering Sideways Markets With Auction Bars and Range Projections
November 19, 2024
Enhancing Your Automated Trading System: Key Insights from Best Pro Trade
November 14, 2024
NinjaTrader New Ecosystem Tools: October 2024 Edition
Enter Email for Updates