BuySide Global’s proprietary software algorithms track Institutional Traders as they change their bids and offers, identify when Institutions are selling into the highs or buying into the lows and deliver real-time buy and sell signals on time-tested strategies. Learn more!
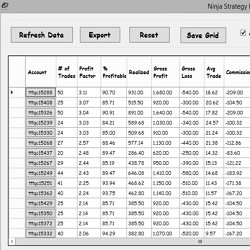
View strategy performance results calculated outside of the NinjaTrader platform. The Strategy Performance tool uses a CPU process separate from NinjaTrader to extract a detailed trade performance summary from Market Replay, Live or Simulated Trading.
For new or current traders who wish to learn what it takes to gain knowledge and confidence to become more consistent in their trading, this course includes the following sections: Price Action Mastery Overview, Price Action Q&A Recorded Webinar, Understanding Market Sentiment & a Trader Assessment.
Traders formation, trading strategies and deployment using the NinjaTrader platform, trading plan, journal and back testing. From finding a hedge, to money and risk management and trading strategy deployment.
Day Trading Radio is a live online market broadcast led by John Kurisko, a full-time trader of nearly 25 years. The show kicks off every morning around 8:30 am (EST) with live trading and technical analysis of the markets in real time. Get trade alerts and trade with 100’s of traders every day.
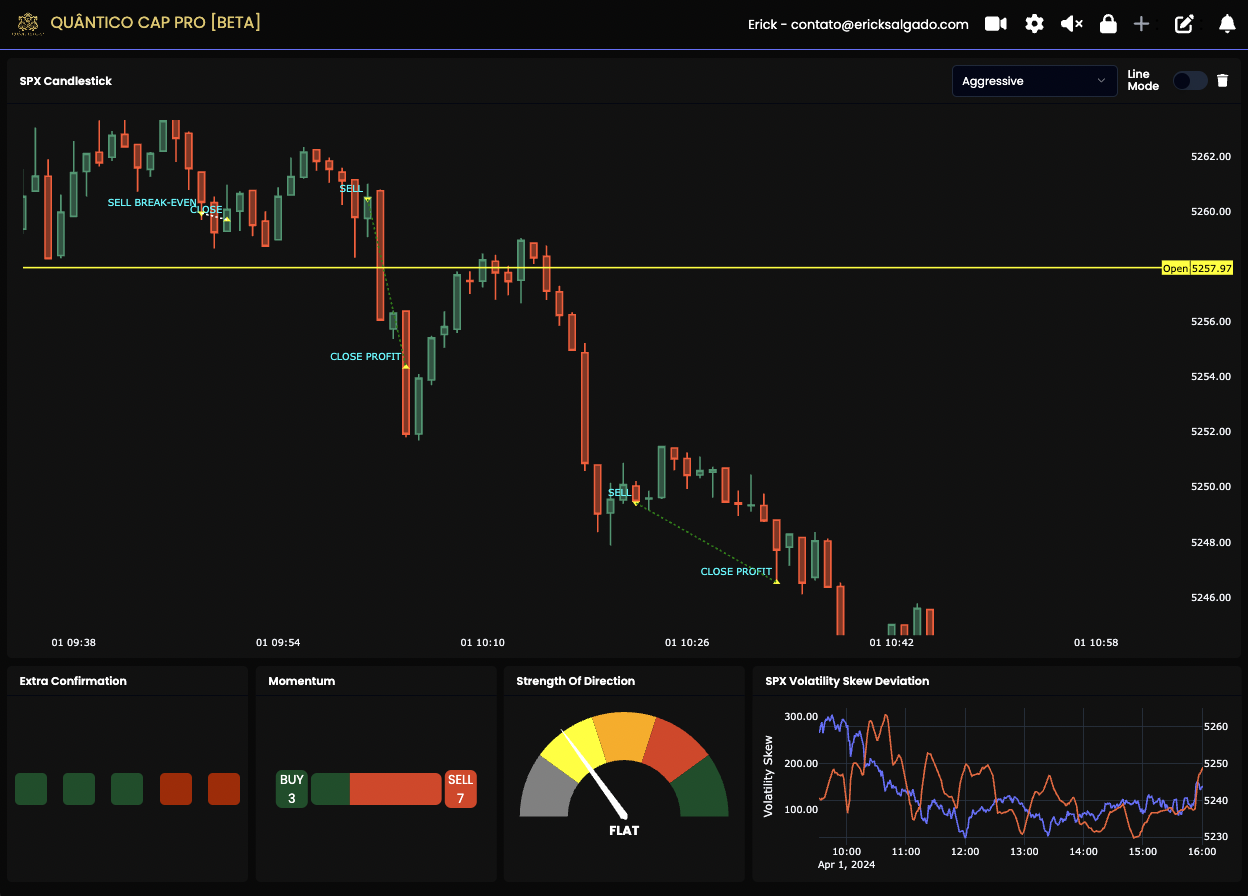
Access clear buy and sell signals tailored for trading precisely when our algorithm detects market maker interventions. Exclusively offered for ES and NQ, seize the opportunity to join our community of hundreds of traders already leveraging 0DTE and Market Maker setups.
OTM Volume Profile is essential to understand the auction behavior and find key price reaction zones, such as the VPO, high and low value area. This profile preserves and allows to visualize these levels historically, which distinguishes it from static profiles.
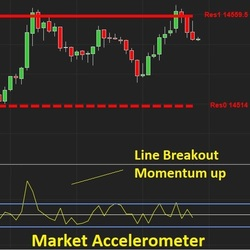
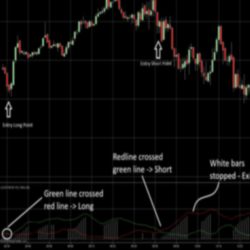
The E.G. AI Accelerometer reveals the driving force behind the price movements of an asset; by measuring how many buyers and sellers are in a market, it helps you form a view of the future direction of the price and – crucially – how fast that movement may be.
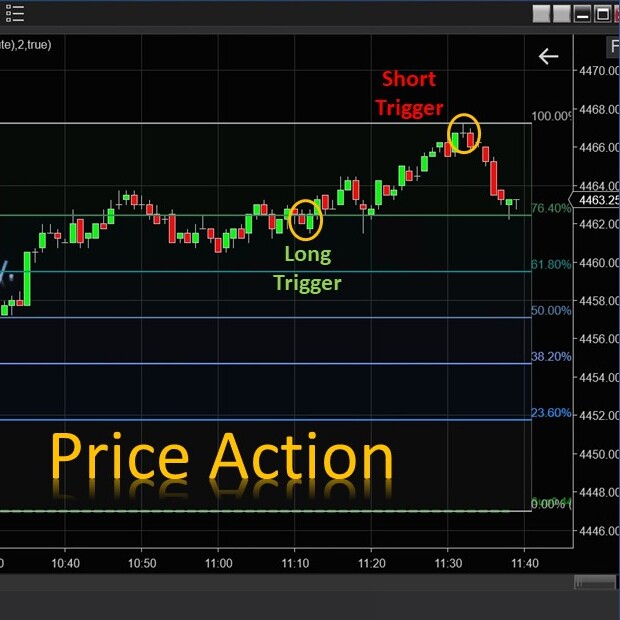
The E.G. Price Action is automatically integrated with the E.G. Trigger Point presented on your chart to generate short and long signals for you. It recognizes Price Action opportunities and generates arrows presented on your chart and sound notifications.
QWLoL is a new concept indicator – “LoL” stands for Limit of Length. That is what we are looking for in situations where the market is moving sideways but there is trending inside the curve. The challenge is to identify the length of the curve & estimate with consistency whether the price rebounds.
December 2, 2024
Mastering Sideways Markets With Auction Bars and Range Projections
November 19, 2024
Enhancing Your Automated Trading System: Key Insights from Best Pro Trade
November 14, 2024
NinjaTrader New Ecosystem Tools: October 2024 Edition
Enter Email for Updates