OTS Trading Strategies - Drawing from over 30 years of trading experience, OTS is delighted to offer exclusive insights into proprietary trading strategies.
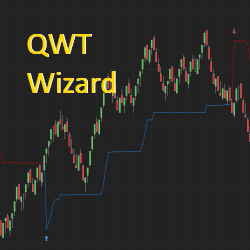
This indicator uses the simple idea of momentum reversal and identifies an entry or exit position. It also shows if the market is sideways or trending. Wizard was named after a trader who was nicknamed “The Wizard” for the use he got out of this algo.
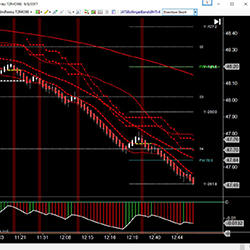
If you seek a trend-following system capable of minimizing failed entry signals in choppy markets, your search ends with RK-System Platinum v4. This system provides up to 4 signal types, with the price action signal type proving to be particularly reliable and productive in our backtesting.
The JATS™ Complete Package* includes the JATSLRTLines™ Indicator for NT8 as well as a comprehensive set of Black Box Shark Indicators BloodHound Templates customized for NinjaTrader Charts and the Market Analyzer.
The market is either trending or ranging. This indicator from Tyche Trading gives you the power to know exactly when it is ranging with a high level of precision. Their Auto-Trading Range Indicator makes it easy to know what price to enter and exit your trades at. Get a seven-day free trial today!
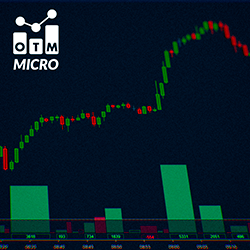
The OTM Micro Delta indicator allows you to identify buying or selling interest. With a reference threshold, it filters out significant movements. It is useful for detecting large price movements.
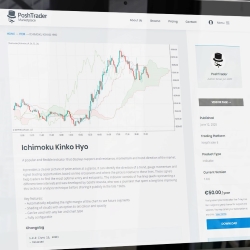
PoshTrader is a fintech company based in Estonia that specializes in custom development and out-of-box solutions for traders. We convert, retain and increase the lifetime value of trading platforms. Our work focuses on enhancing the trader's experience and performance.
Their European open LTR targets the Nasdaq, S&P 500 and FDAX. They cater for new to expert traders. They combine a highly successful 5-minute chart trading technique with 15 & 60 minutes charts.
CB ZoneChart V5.0 update was just released. It now comes with turning bars included to help gage the tops and bottoms or turns in the market. Also includes the opening ranges, zigzag support and resistance, golden zone Fibs, and the most requested blue dotted lines support and resistance.
David Misselhorn is a software developer with over 30 years of development experience in trading clients, market data and order-execution software. He writes indicators and strategies for individuals wishing to automate their trading and analysis activities.
December 2, 2024
Mastering Sideways Markets With Auction Bars and Range Projections
November 19, 2024
Enhancing Your Automated Trading System: Key Insights from Best Pro Trade
November 14, 2024
NinjaTrader New Ecosystem Tools: October 2024 Edition
Enter Email for Updates