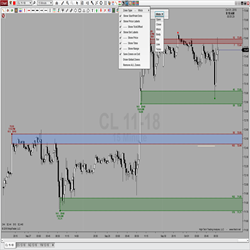
Creating, displaying & saving levels of interest could not be easier! Simply double click above or below any bar to automatically add or remove zones. This features 8 unique Zone Types, a right click context menu & toolbar icon for simple configuration, and is global drawing & template capable!
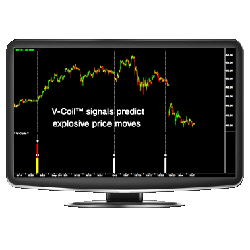
The V-Coils™ & NR Breakouts Indicator Package detects significant contractions and expansions in volatility and Average True Range (ATR). It issues signals when there is a very high probability for an explosion in volatility - leading to huge price moves that traders can take advantage of.
A comprehensive Automated System including 20 strategies covering a broad range of instruments and market conditions. Includes indicators, color backgrounds, and a powerful money management module to protect profits and principal. Learn more.
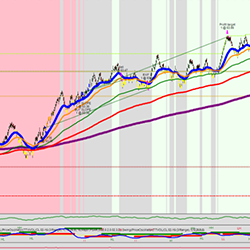
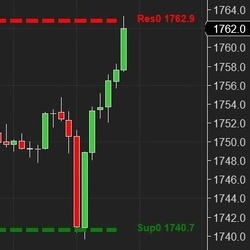
Based on an Artificial Intelligence (AI) engine, the E.G. Trigger Point calculates support and resistance (S&R) lines. The S&R are specific price points on a chart expected to attract the maximum amount of either buying or selling.
A comprehensive package for both beginners & intermediate traders. It has been designed to help you towards building or understanding strategy construction. This will help you trade sustainable, scaleable and reproducible strategies with conviction to achieve consistent performance.
Apex Investing Institute is a community of “traders helping traders”. They have a live trade room open 23 hours per day, with live commentary and trade set ups called out each morning. Education, systems, indicators, mastery courses and semi-automated trading software.
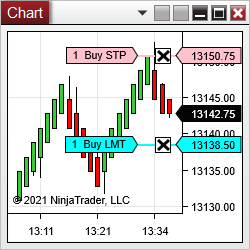
Clicker allows one to enter orders with one click directly on the chart! Modifier keys and mouse buttons for buying and selling are configurable. The order type is detected from the clicked price relative to the market price. All order parameters come from ChartTrader. Free trial for seven days.
Innovative Trading Solutions has been building indicators, fully-automated or ATM Strategies, chart types, and chart styles to client specifications for over 8 years. They also offer NinjaTrader 7 to NinjaTrader 8 conversion services. Get a free quote for your project today!
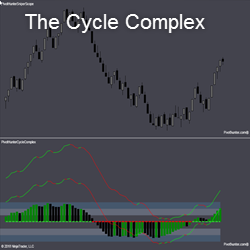
THE CYCLE COMPLEX measures price momentum at 4 levels: the histogram, 2 lines of higher sensitivity, and a dotted bull bear line. When the histogram is in the bands and turns, the pivot is often stronger. If the histogram is above or below the bands, the strength is even greater.
The Smart Momentum NinjaTrader Indicator tool has a unique design compared to other momentum indicators. It uses an averaging mechanism that analyzes the cycle and adapts to it. This results in a momentum plot that is simultaneously smooth and sensitive.
December 2, 2024
Mastering Sideways Markets With Auction Bars and Range Projections
November 19, 2024
Enhancing Your Automated Trading System: Key Insights from Best Pro Trade
November 14, 2024
NinjaTrader New Ecosystem Tools: October 2024 Edition
Enter Email for Updates