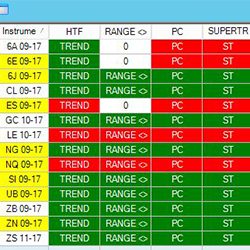
The JATS Market Analyzer Template for the NinjaTrader 8 platform has customized blackbox BloodHound solvers that show when momentum, linear regression and trend are in synchronization across multiple time frames.
Don't miss any more targets by a few ticks with Target Zone!
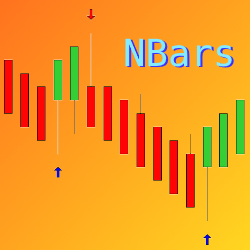
The TIS_NBars_UpDown indicator paints signals of the "OpenClose Setup" on the chart. It detects bar color changes and includes multiple filters for fine-tuning. See a video demonstration of the Nbars indicator in action.
A complete course designed to teach you how to install NinjaTrader 8, how to install our templates and custom indicators, and how to day trade S&P Futures. Our method is similar to swing trading and scalping combined - but trades are only for the current day. Three-day money-back guarantee.
Gain an edge over the competition with FX indicators that calculate the Stochastics, RSI, DMI, ADX, ATR, and Verticality of each currency! The Fibozachi Forex Force indicators tell you exactly which currencies are the strongest and weakest, and which pairs have the most favorable correlations!
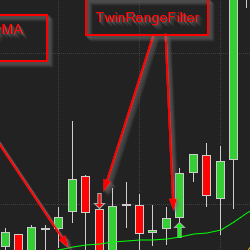
The Twin Range Strat employs two indicators (the Twin Range Filter and the RedKSmoothAndLazyMA) to genterate ATM Orders. The quantity, stops and trailing are all handled by the ATM and you, if you like!
Indonesian-speaking. This channel is a place to learn forex, crypto and stock trading using ICT methods. Make daily analysis, design trading plans correctly and measurably.
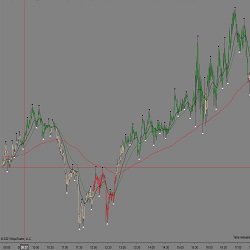
Trend Friend is a simple indicator designed to identify when the price in different time periods is aligned with select moving averages. It is not a closed methodology to operate but you can establish two systems to use this indicator: aggressive operation to paint signals or wait for a retracement.
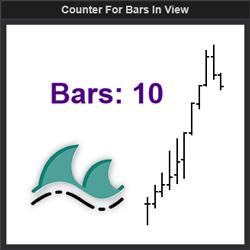
This indicator displays the number of bars in view along with visual reminders if the user is over a defined limit. This increases application functionality and user charting efficiency.
CB ZoneChart V5.0 update was just released. It now comes with turning bars included to help gage the tops and bottoms or turns in the market. Also includes the opening ranges, zigzag support and resistance, golden zone Fibs, and the most requested blue dotted lines support and resistance.
December 2, 2024
Mastering Sideways Markets With Auction Bars and Range Projections
November 19, 2024
Enhancing Your Automated Trading System: Key Insights from Best Pro Trade
November 14, 2024
NinjaTrader New Ecosystem Tools: October 2024 Edition
Enter Email for Updates