Bstrader-automatic is a powerful trend following automated trading system. It has customizable parameters, different position sizing methods, fixed size, equity percentage, atr, price percentage, ATR Trailing Stop, Market Money Scale In and Scale Out, Volatility Compass, Daily loss limit and more.
Universal Oscillator is an indicator that operates on the general principles of the RSI, CCI and OsMA oscillators. It helps you to identify potential upcoming reversals based on the values of the oscillator.
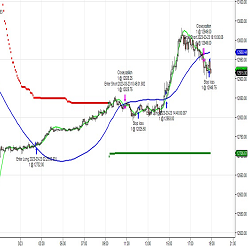
Entry Signals from TREMPER.com generates entries based on proprietary internal conditions. It allows you to manage your position based on chart size and your parameters.
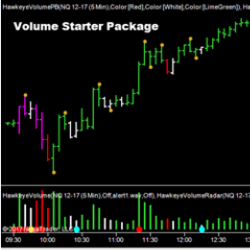
Hawkeye Starter Package is an immensely powerful leading indicator that performs over 300 calculations per bar to analyze the price action and associated volume, signaling price movement prior to it happening. Buy the Hawkeye Starter Package now at its affordable low price!
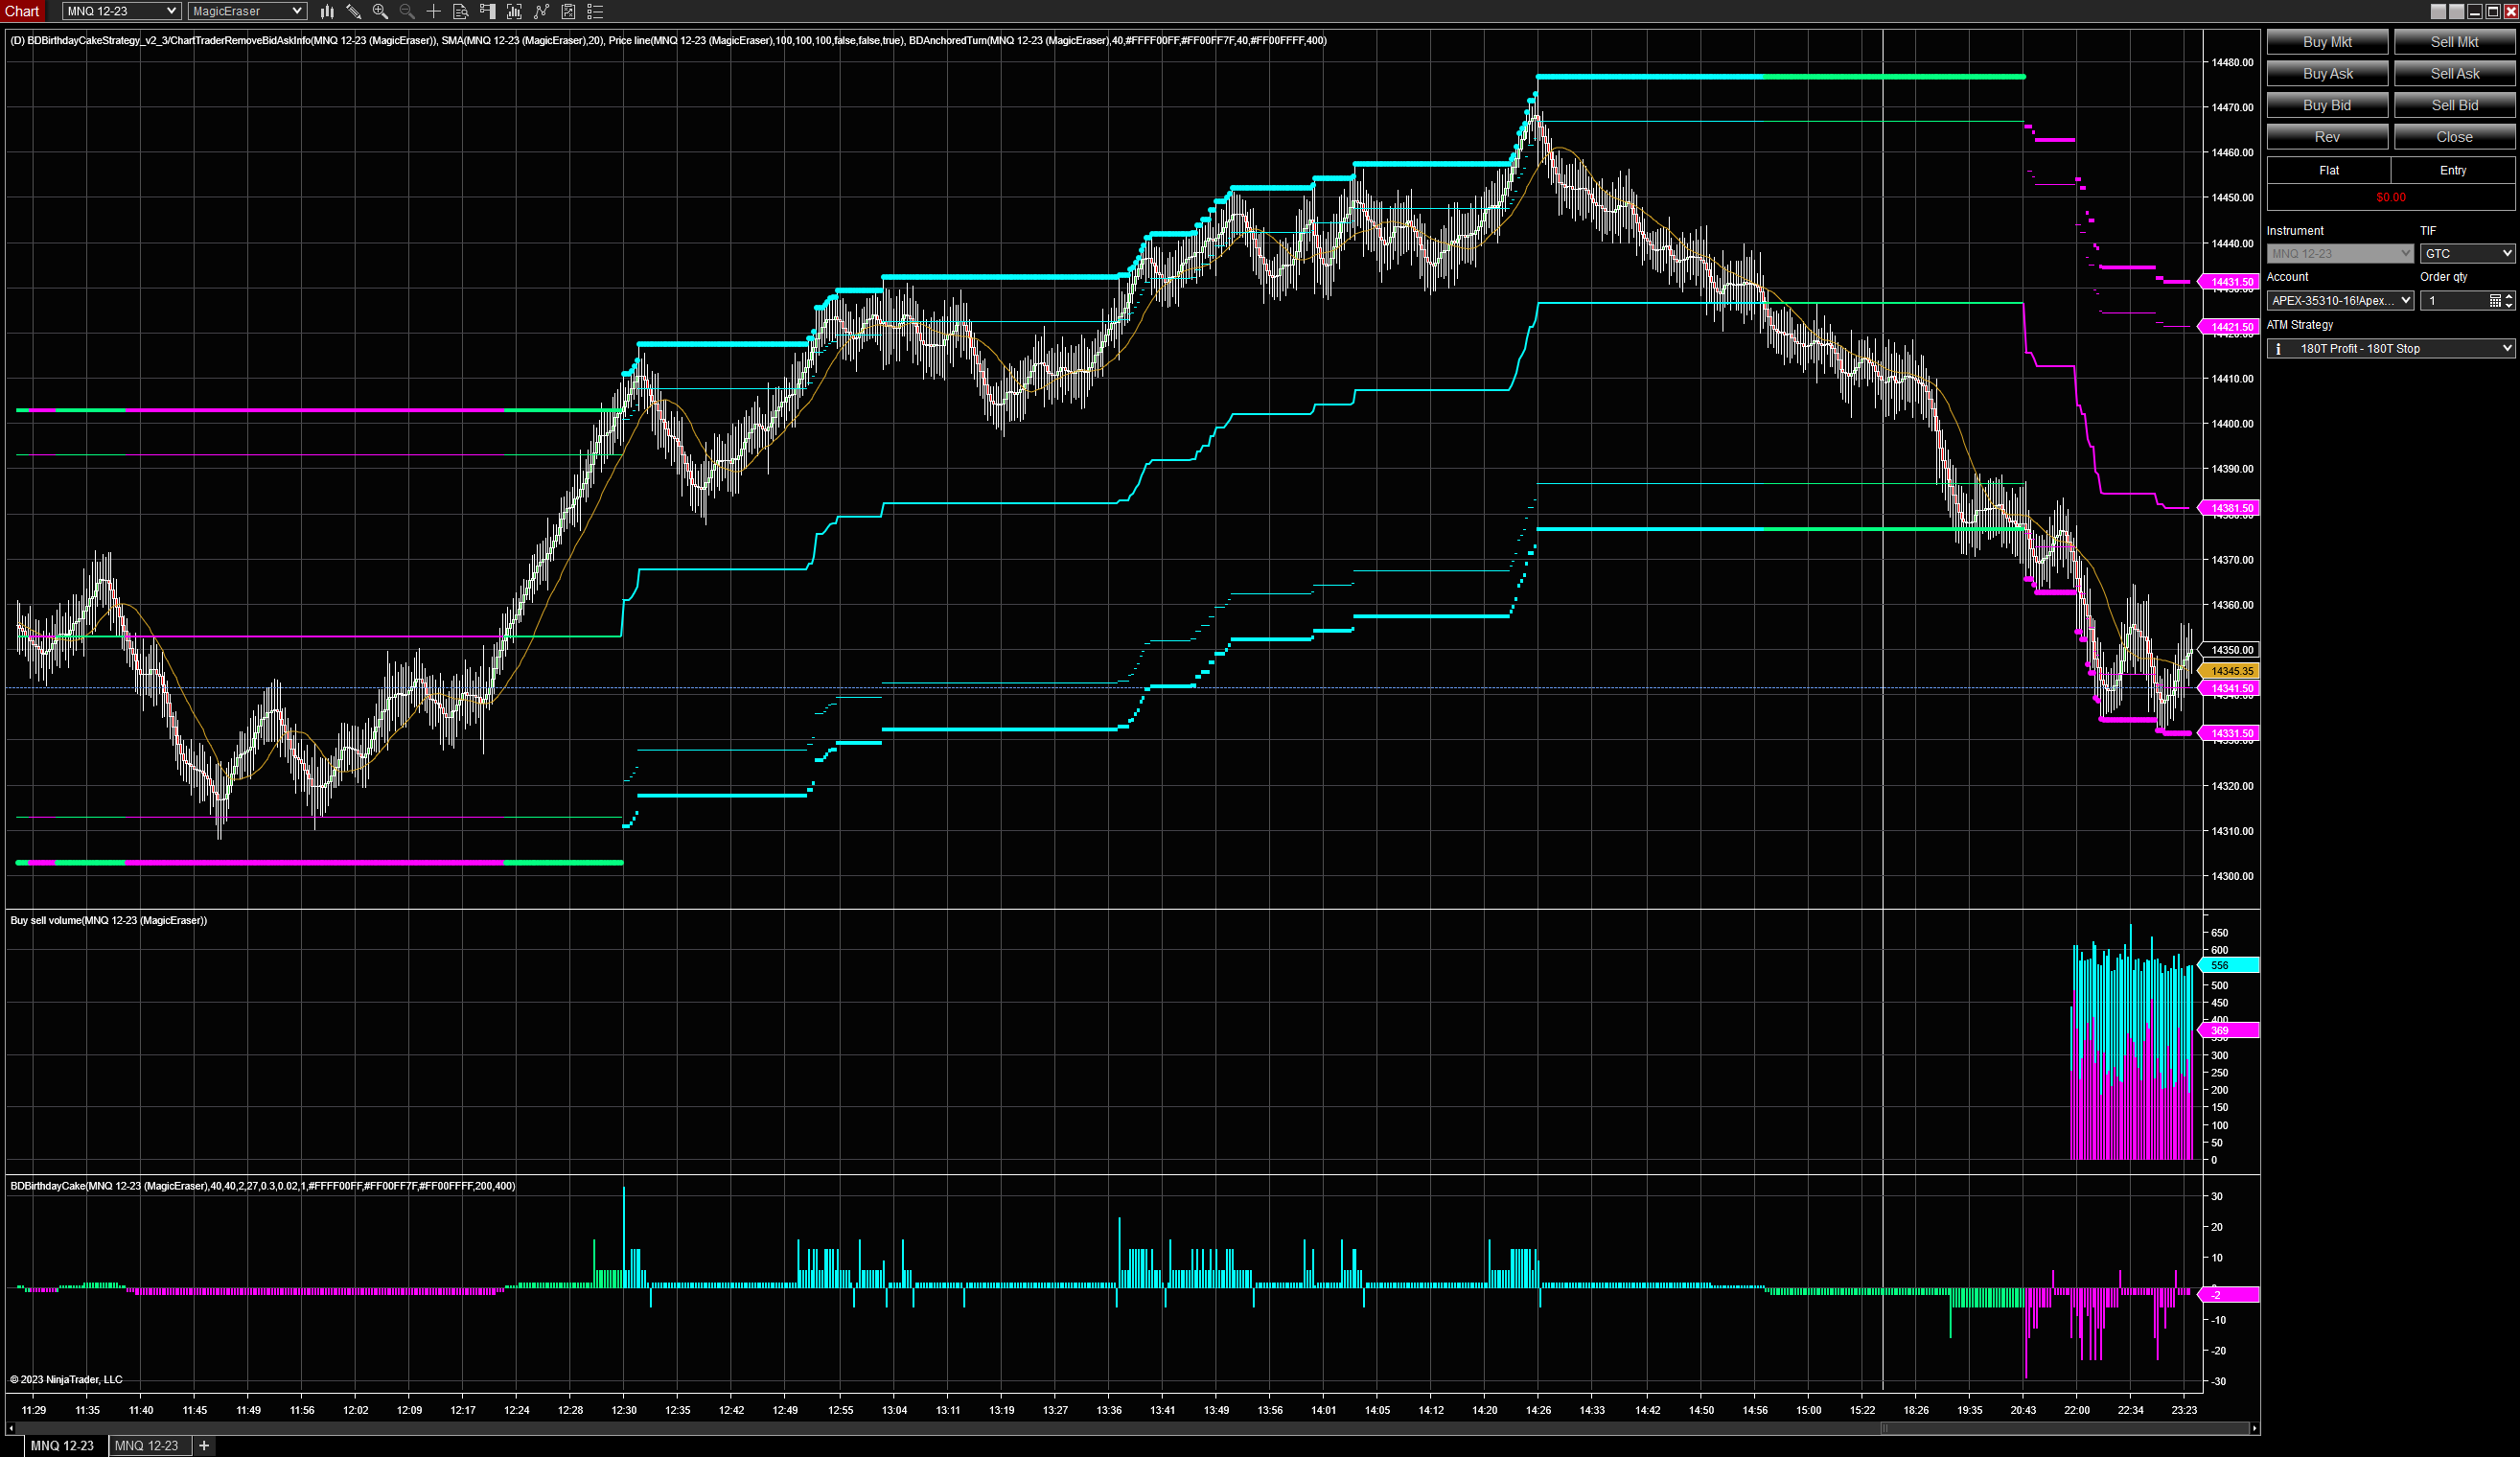
These bars reduce the number of reported crosses at a specific price due to wide spreads and fast DOM action. If your strategies require entries at a specific price you will find that these bars reduce the whipsaws in tick based bars.
Precision Index Oscillator (Pi-Osc) can provide trade timing signals and is a consensus indicator with some powerful variances to industry standard oscillators. At first glance, it would appear like any other oscillator, but when viewing it in tandem with other indicators the differences are clear.
Learn how to build a backtested trading strategy with a known edge using the strategy development lifecycle process. You will be taking an Idea to an actionable trade plan! Start trading live with a tested strategy that can be adapted to futures, ETFs and options of S&P 500 and Nasdaq 100 Indices.
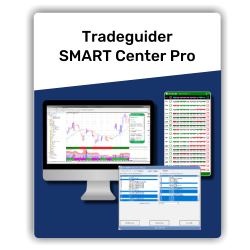
Gain a competitive edge via the proven performance of Wyckoff VSA and its fully customizable SMART package, which is configurable to your individual trading plan, style and strategy. Fully configurable SMART Technology. Advanced configurable trading filters. Advanced management tools.
Click Trader is designed for quick and efficient chart trader order entry. Enter and manage trades with one click. No more working with the right-click menu. Sync multiple stops or targets to the same price in a single click. Works with ATM strategy stops and targets.
T2SSupplyDemand is an indicator used to enter high-probability trades. Get notified in real time by email, text message or your favorite sound when the price is about to enter key zones & when it touches fresh zones. Don't stare at a screen, wait for the right signal in supply and demand zones.
March 25, 2024
Trading Pullbacks and Reversals: Simplifying a Once Complex Retail Trading Strategy
March 21, 2024
VWAP Indicator: Average Price Shown Based on Price, Volume
March 18, 2024
Trade Copier Strategies: Make Efficiency Work for You When Futures Trading
Enter Email for Updates