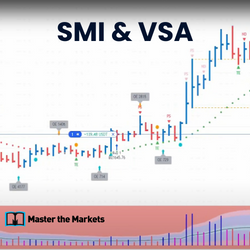
SMI was developed by the quants in the 1960's to help quantify tops and bottoms. It gives 3 strategy stats based on probabilities. However, a small limitation of the SMI is in selecting the T&Bs that are going to run. VSA helps you overcome that by looking at the volume for a big move.
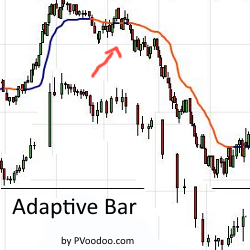
The AdaptiveBar is a revolutionary bar type that incorporates volume, time and range. Available exclusively for NinjaTrader 8 this bar dynamically captures volume and range data based on a user defined time frame to add clarity to market behavior. Learn more!
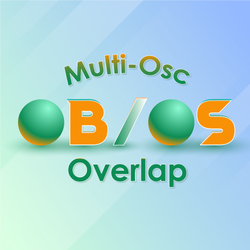
When MFI, RSI and Stochastic converge, the background is colored, signifying the overlapping zone and triggering immediate alerts via chart markers. This visually appealing and efficient tool excels beyond conventional oscillator applications, optimizing chart space for essential information.
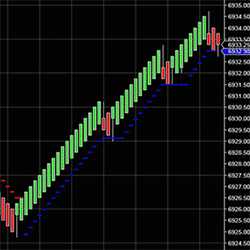
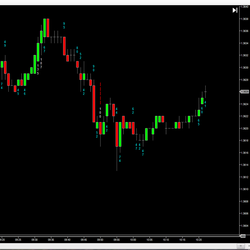
Trailing Stops move with the price action, not a lagging indicator. The indicator was designed for traders to use and to have no hassles of calculating your stop losses. The software does it automatically; never second guess the trend again. Can be used to lock in and protect your profits.
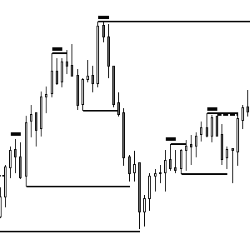
This indicator shows Double Bottoms and Double Tops which are tested by subsequent price action. It shows micro Double Bottoms & micro Double Tops as well. Use it as a discretionary indicator and for automated trading (e.g. BloodHound). Get started with a free 20-day trial today!
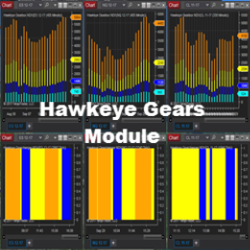
The GearCombo Module is designed to show you the correct tick speed to trade each market daily. Once the four time-frames have been generated by GearBox, GearChanger shows you which tick speed to trade at any specific point during the day. GearCombo includes GearBox and GearChanger for all markets.
This NinjaTrader indicator is programmed to highlight the big money trades. The numbers are placed under each bar which makes it easy to see where the action/noise is taking place.
Tired of missing out on how the news spins off a big move? Frustrated that you think you have an edge but instead of working it, you get worked by it? Afraid to even check out the news at all? Get SupraNews and time your trades with the confidence and assurance of having a consistent edge.
The ELITE Pack includes 44 in-depth Volume Profile training videos, 15 hours of video content and hundreds of real trade examples. Get intraday & swing Volume Profile levels, signals & video! It also includes access to the member forum and custom-built Volume Profile indicators for NinjaTrader 8.
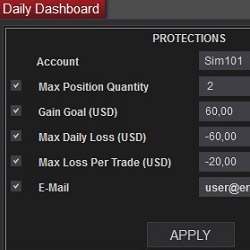
Protect your losses in a trade and daily basis. Do not grow a position more than planned. Daily Dashboard is the tool to support you against your bad behavior in the stressful moments.
March 25, 2024
Trading Pullbacks and Reversals: Simplifying a Once Complex Retail Trading Strategy
March 21, 2024
VWAP Indicator: Average Price Shown Based on Price, Volume
March 18, 2024
Trade Copier Strategies: Make Efficiency Work for You When Futures Trading
Enter Email for Updates