With decades of experience, EMS specializes in the creation of custom software for clients worldwide. For over twenty-five years, EMS has been helping our clients reach their goals with honesty, integrity and fairness. Contact us for a complementary consultation.
An in-depth course specifically developed to trade Nasdaq futures using Bookmap.com and take advantage of its unique behavior, the NQ Order Flow course includes 3 hours of deep dive into all order flow patterns and how to exactly trade them, exhaustions, absorptions, spoofs, book flips and more.
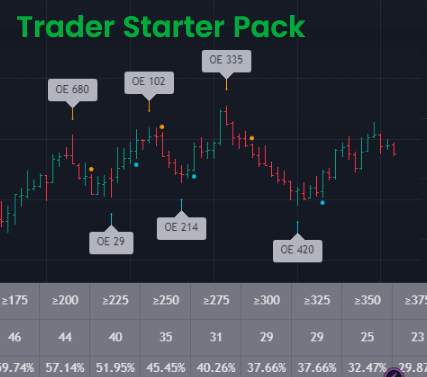
Welcome to the Trader Starter Pack: This free 5-day video course that’s taken over 38 years of combined trading experience, along with everything they’ve learnt from coaching over 20,000 clients, and packed it all into this easy to follow 5-day video course.
This model balances three separate risk lenses that seek to generate alpha while moderating standard deviation over multi-year periods. Each risk lens is independently applied based on Alpha Vee's breakthrough fundamental momentum research. Contact Alpha Vee for more information.
Curious about NinjaTrader 8's supplied indicators, or seeking detailed information about them? Follow this link for an in-depth exploration of each indicator, providing you with the knowledge you need for effective trading. Dive into comprehensive insights now!
Grab this FREE 10-page guide today! Discover little-known chart settings that will have a huge impact on your trading consistency.
Each week you will receive any qualifying HPS Trades delivered to you and tracked on the HighProbabilitySetup Website. You can decide what trades you want to take. Please track them all on our interactive platform.
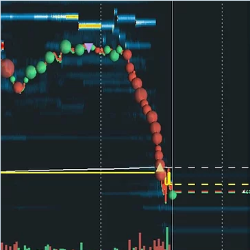
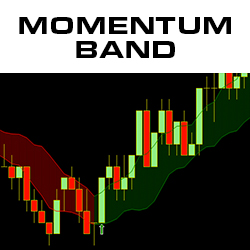
The Momentum Band indicator shows the trend and takes the noise out of the market, keeping you in trades longer, as you won’t get shaken out by temporary price fluctuations. Color changes and arrows indicate significant changes in momentum. Stay in Trades Longer & Download the Momentum Band Today!
The Pyramid Bundle is a great value and contains our entire collection of current and future indicators. As an owner, you'll never pay more for premium support, upgrades or new product releases. Receive instant access to our entire collection of indicators with a free 14-day trial!
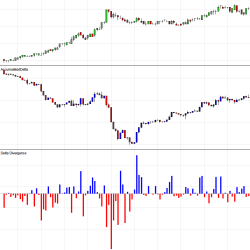
Delta Divergence & Accumulated Delta is a set of 2 advanced indicators that show the difference between buyers and sellers entering the market. Delta Divergence shows the delta of each bar; Accumulated Delta shows the development of delta over the session or between sessions. Try it now for free!
March 25, 2024
Trading Pullbacks and Reversals: Simplifying a Once Complex Retail Trading Strategy
March 21, 2024
VWAP Indicator: Average Price Shown Based on Price, Volume
March 18, 2024
Trade Copier Strategies: Make Efficiency Work for You When Futures Trading
Enter Email for Updates