At Professional Software Solutions, we have years of experience in developing automated trading systems, indicators, alerts, conversions from other platforms and interactive training. We offer fixed pricing, reasonable rates, quick delivery and documentation.
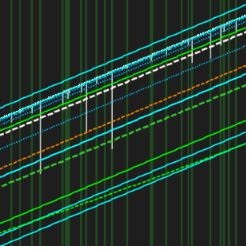
This custom BloodHound template is setup for the UniRenko Bar and waits to trigger signals as the market pulls back into the moving averages. The JATS X-RE-X Blackbox BloodHound Template allows you to execute at the specific EMA entry locations after pullbacks.
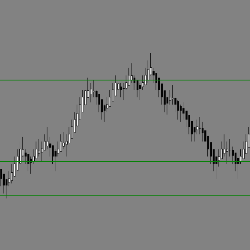
The EPyFSwingLevels indicator identifies the most relevant structure levels. Once the indicator is loaded within a chart, it automatically reflects areas where the price reacts.
SpyBot Ranger Indicator is an ORB Open Range Breakout Strategy indicator for NinjaTrader 8. Many institutions trade using this strategy.
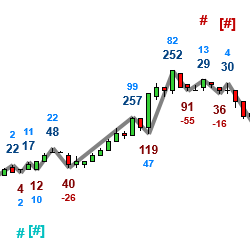
MBoxWave Algorithmic Buy / Sell Signals use Wyckoff concepts in analyzing waves, volume, delta volume, effort / result, etc... It allows you to easily scan charts for certain conditions to meet a criteria and then showing a signal that a potential trade setup has occurred.
See trade setups develop in real time in the Easy E-mini Trade Chat Room! Open Monday – Thursday 9:15 – 12:00 ET, sign up for your 3-day trial today!
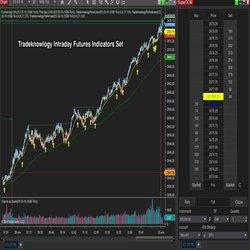
Tradeknowlogy offers indicators for intraday futures trading aimed at eliminating noise from the markets. The indicator clearly displays the market trend, entry & exit opportunities & helps reduce emotional based trading decisions.
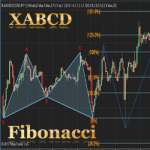
XABCD 5-point chart patterns are very common and popular in technical analysis. As the name suggests, XABCD pattern has 5 points and 4 legs formed by those 5 points. The concept of the XABCD 5-point pattern can be understood on a chart.
This trading masterclass delivers all the fundamental knowledge and trading skills as the foundations on which to develop your trading career for financial, commodity and digital asset classes. Up to one year to complete. Includes a free trading challenge to qualify for a funded trading account.
A comprehensive package for both beginners & intermediate traders. It has been designed to help you towards building or understanding strategy construction. This will help you trade sustainable, scaleable and reproducible strategies with conviction to achieve consistent performance.
March 25, 2024
Trading Pullbacks and Reversals: Simplifying a Once Complex Retail Trading Strategy
March 21, 2024
VWAP Indicator: Average Price Shown Based on Price, Volume
March 18, 2024
Trade Copier Strategies: Make Efficiency Work for You When Futures Trading
Enter Email for Updates
/ProgrammingServices-250x250.jpg)