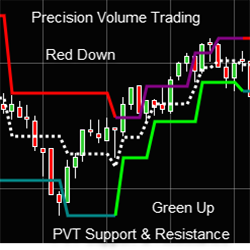
Precision Volume Trading Support & Resistance measures each swing point for traders to know where buyers and sellers are.
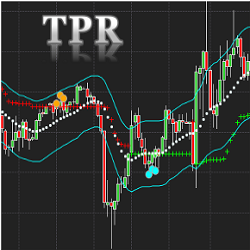
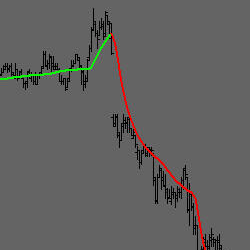
The Trend Pullback Reversal (TPR) Indicator displays possible price trends with pullback and reversal signals. TPR will focus on the main trend and filter out most minor price movements. The NinjaTrader 8 version comes with a unique band and center line as additional features.
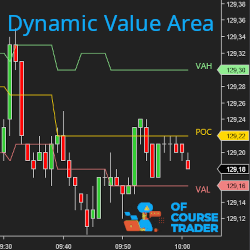
The Dynamic Value Area allows you to visualize in real time the evolution of the POC, VAL, VAH levels corresponding to the most traded value area. It also gives you historical levels. Its NinjaScript API will allow you to integrate the value area into your own indicators and strategies.
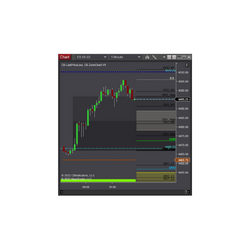
CB ZoneChart V4 is a longer-term day trade indicator that shows support and resistance, fibs and opening range areas. It has many settings and has been updated over the years (since 2016). Combining it with the other CB Indicators makes a great combo. Try it out with a 14-day free trial!
This incredibly innovative suite of Bollinger Bands and divergence indicators shows selected, plotted ‘dots’ with a broad selection of Bollinger Band combinations. You can choose from seven indicator combinations!
SignalStack is a fast, easy and simple way to convert any alert from any trading platform into an executed order in any brokerage account – automatically and without writing any code.
PLA Dynamical GOLD is a complex moving average that has 101 different speeds per length, overshoot true or false input, anti-reverse true or false input, and anti-reverse percentage adjustment. Also included is a fast start algorithm which requires only 10 bars of data to compute an output value.
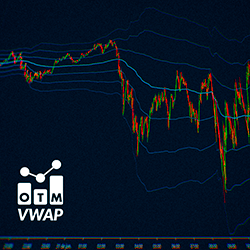
OTM VWAP, the "Volume Weighted Average Price," acts as a moving average based on trading volume. It includes the central VWAP, which serves as support or resistance depending on the price position and its deviations. With this indicator you can set VWAP per session, weekly and monthly.
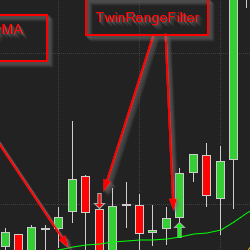
The Twin Range Strat employs two indicators (the Twin Range Filter and the RedKSmoothAndLazyMA) to genterate ATM Orders. The quantity, stops and trailing are all handled by the ATM and you, if you like!
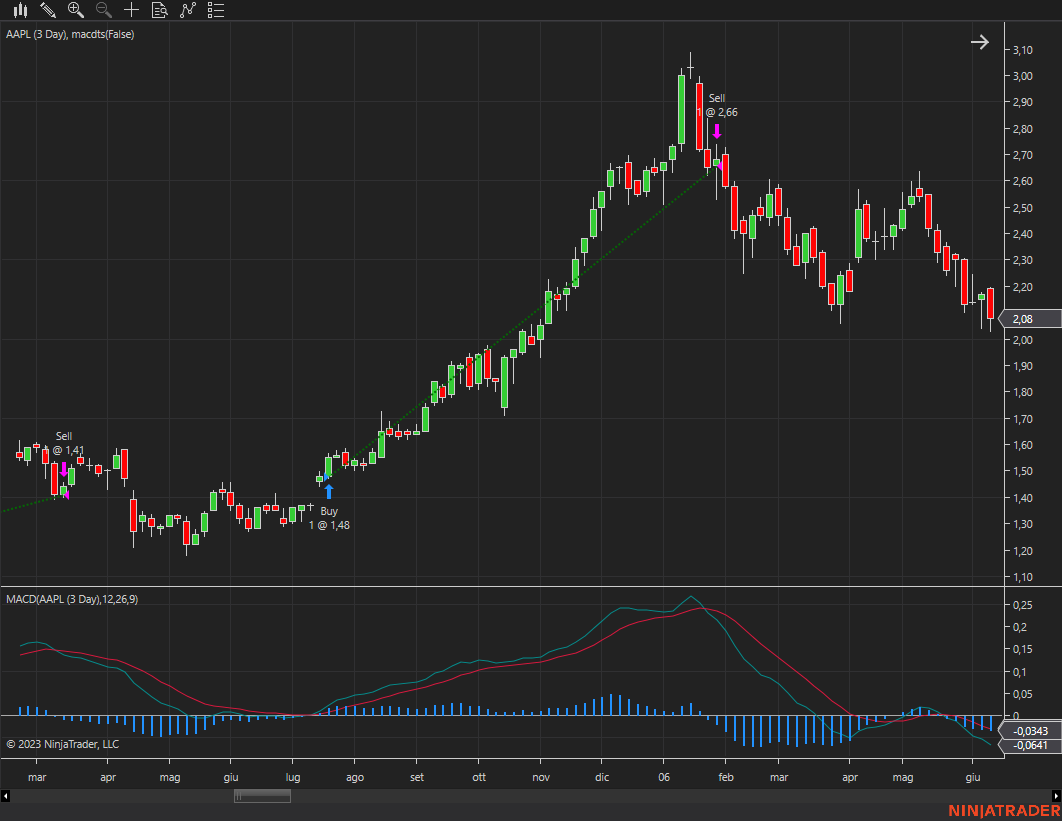
Trading system based on the MACD indicator, exploiting breakouts and trend persistence.
December 2, 2024
Mastering Sideways Markets With Auction Bars and Range Projections
November 19, 2024
Enhancing Your Automated Trading System: Key Insights from Best Pro Trade
November 14, 2024
NinjaTrader New Ecosystem Tools: October 2024 Edition
Enter Email for Updates