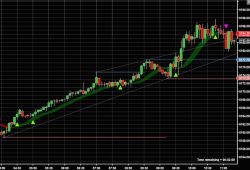
Trend Support & Resistance works great as a companion to the Trend Ribbon & Buy/Sell indicators. This indicator identifies support & resistance levels plus forecasts highs / lows. Helps you predict upcoming reversals with confidence. Adjust to your style of trading: intra-day, swing or longer.
If you’re struggling with specific issues such as your entry or even your exit or developing a strategy that works for you, the first port of call is a free 15-minute consultation where we can discuss your needs and formulate a 1-on-1 mentoring plan. Reach out no matter what your trading issue is!
Automatic ATM Entry Assistant (AUTOBOT) can be used with our indicators and others using native Ninjatrader 8 Arrows or Triangles on the chart. Set up complex entry parameters without coding. Continue to our product page to see the 25-minute video of how it works.
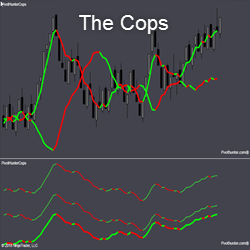
THE COPS includes the duo, Dog and Sheriff, working in close harmony. Dog swings wide when The Convict begins to run. When Dog is narrow, traders wait for the separation before considering a market entry. The COPS in the bottom panel measure momentum at 3 levels.
Our intelligent and powerful automated strategies let you rule the markets like a pro. Algos are available for most popular futures markets and are ready to go out of the box. Our strategies are NinjaTrader 7 & NinjaTrader 8 compatible to take your trading to the next level.
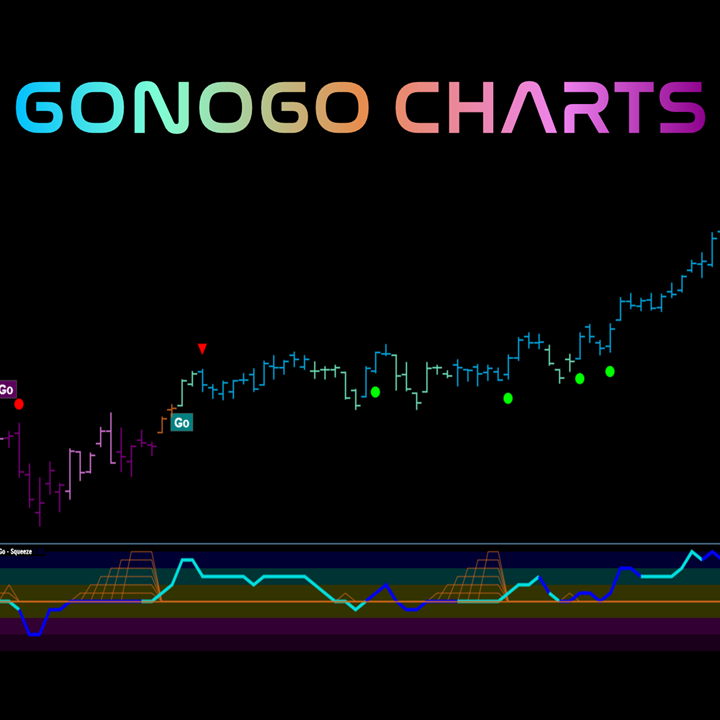
GoNoGo Charts® incorporates multiple widely tested and commonly used technical indicators into proprietary trend and momentum models for a complete technical perspective without cluttering your charts. GoNoGo Trend® is a model that includes tools like multiple period moving averages and more.
The Angels and Demons Indicator shows current and past support and resistance levels. It can be applied to multiple time frames, making it suitable for swing and position traders as well as day traders. Easily visualize important price levels where longs and shorts attempt their defense!
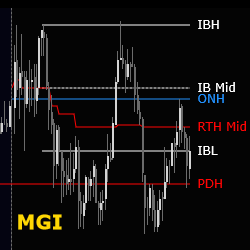
This free MGI (Market Generated Information) indicator automates the process of adding useful information on your chart to help identify trading opportunities, market context and areas of interest to help guide decision making. Three indicators are offered for daily, weekly and monthly time frames.
Our Swing Trading software is based on price, support & resistance. It has undergone over 1000 hours of machine learning to build its algorithm. We send out algorithm updates regularly to keep the system performing. It is built and tuned for swing trading.
Learn everything you need to know about charts and technical analysis to become consistent in the markets. This course includes basic structure, support/resistance, trend, supply/demand, Fibonacci, change control zones, divergence, trading psychology, and putting it all together.
December 2, 2024
Mastering Sideways Markets With Auction Bars and Range Projections
November 19, 2024
Enhancing Your Automated Trading System: Key Insights from Best Pro Trade
November 14, 2024
NinjaTrader New Ecosystem Tools: October 2024 Edition
Enter Email for Updates