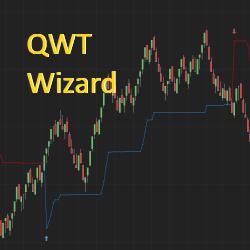
This indicator uses the simple idea of momentum reversal and identifies an entry or exit position. It also shows if the market is sideways or trending. Wizard was named after a trader who was nicknamed “The Wizard” for the use he got out of this algo.
We focus primary on the time side of the markets using Fibonacci, Support and Resistance, Commodity Supply and Demand, Chart Geometric Patterns, Cycles, Seasonals and CoT Report.
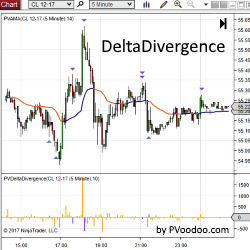
PVDeltaDivergence Indicator is a powerful tool designed to help traders identify possible turning points in their favorite markets with order flow analysis. Get a free trial of PVDeltaDivergence for NinjaTrader today!
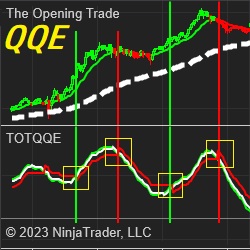
This is the indicator used in the QQE Swing system. This indicator is a version of the popular RSI that, in theory, uses moving averages to smooth the RSI and price. Like any other indicator, this should be paired with additional indicators. It is coded to be used with the strategy builder.
The Historical Volatility Percentile (HVP) is a statistical-based indicator that evaluates the deviation from the average price of an instrument in a given time period. It is usually used to measure the likelihood that a security's price will move away from its current value.
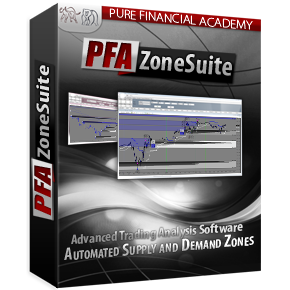
PFAZoneSuite is advanced supply and demand trading! Indicator package includes automated volume zones, volume profile, order flow analytics, trend lines, fibonacci retracements, market structure, trade data box and more! Compatible with NinjaTrader 8. Click here for a free demo!
Do you want to know the trading setups we use? Create your own profile FREE on our website and you’ll have access to our course videos where we explain each of our patterns. Gain the knowledge to access our EPyF Trading Room and learn our way of understanding the market.
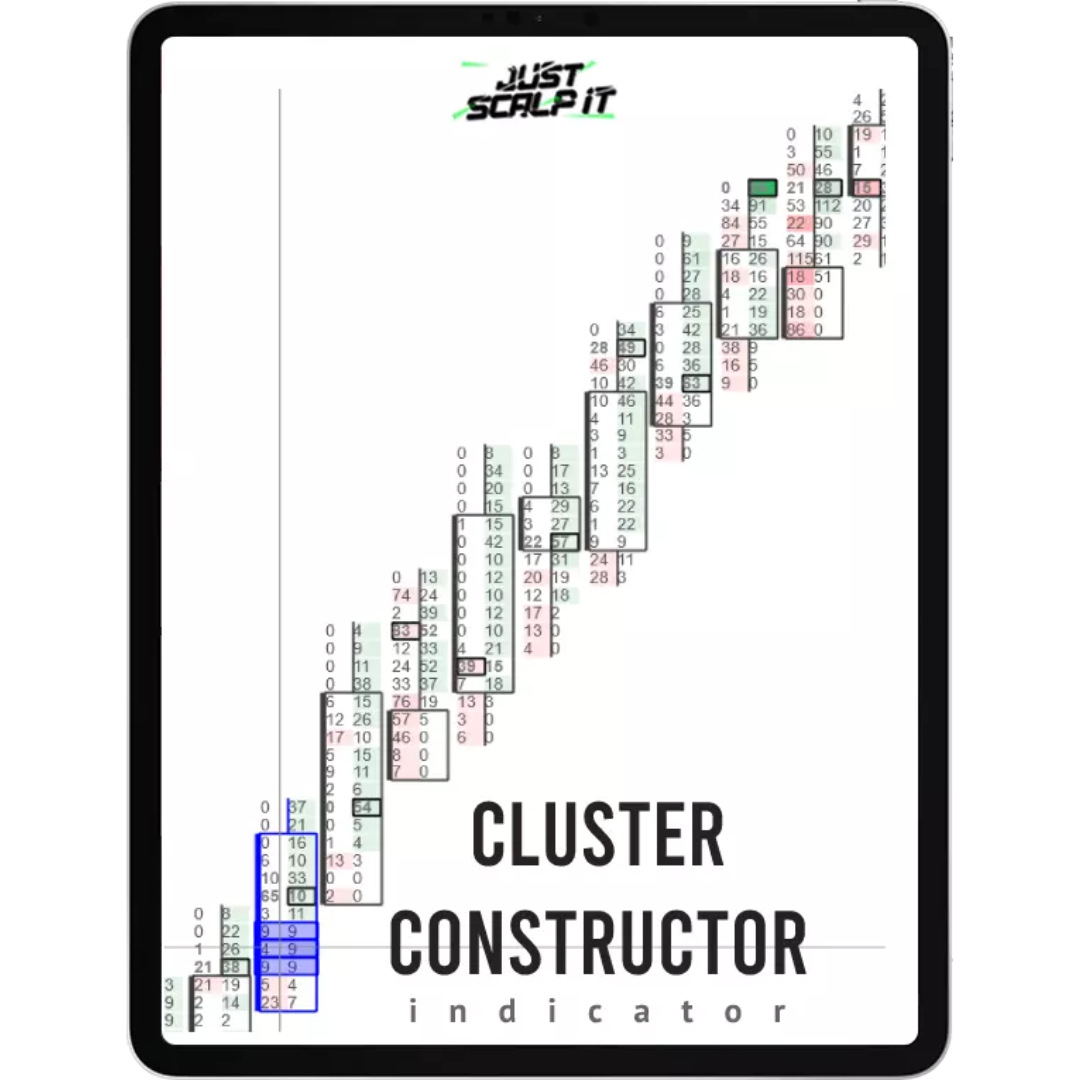
Explore the advanced order flow indicator, Cluster Constructor, featuring 16+ filters for deep market analysis (footprint charts). Ideal for unveiling smart money and institutional trends, enhancing order flow trading strategies. Delve into sophisticated insights – start now!
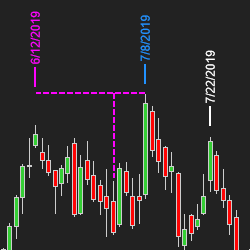
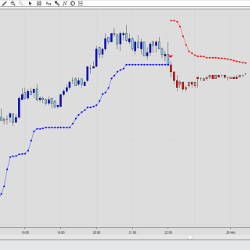
The SuperTrend U11 is a stop and reverse (SAR) indicator that trails price action. The trailing stop adjusts to both trading prices and volatility. When volatility is high, the trailing stop is further away from prices. When volatility is low, the trailing stop moves closer to prices.
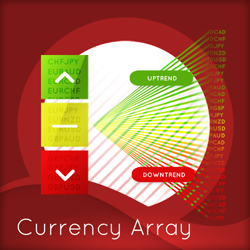
Imagine what it would be like to monitor all 28 currency pairs on one chart. To see trend strength, momentum and congestion revealed instantly and in real time. Throw out your multiple screens and grab your copy now!
March 25, 2024
Trading Pullbacks and Reversals: Simplifying a Once Complex Retail Trading Strategy
March 21, 2024
VWAP Indicator: Average Price Shown Based on Price, Volume
March 18, 2024
Trade Copier Strategies: Make Efficiency Work for You When Futures Trading
Enter Email for Updates