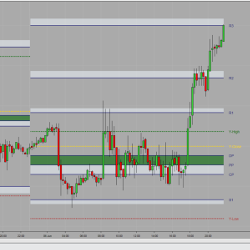
Session Pivots are a well known trading technique to calculate intraday support and resistance points. Because of its simplicity and efficiency, it is still a very reliable method for determining key support and resistance levels.
Q-BarNetDelta indicator shows the net delta above and below the bar, showing the net difference between buying and selling activity during that time.
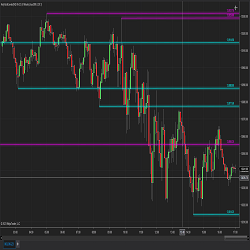
This algorithm calculates the support and resistance based on a look back period (number) of candles or bars and determines the support and resistance levels dynamically.
View stops and targets on your screen based on the ever-changing average true range.
The Diversified Trading System (DTS) brings traders the power of diversification, which can be applied to any trading style. Scalp, swing and trend trade on one instrument or multiple instruments. Only take the very best trade opportunities and ignore the rest. Get started today!
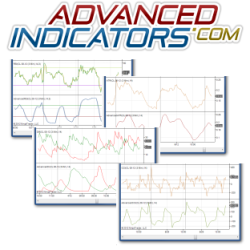
Advanced Indicators are some of the most advanced indicators currently available on the market! Get cutting-edge trading tools - encompassing years of experience in financial market research, engineering, mathematics, a.i., and data science. These unique pro tools not available anywhere else!
The platform is responsible for finding multiple patterns in operations and provides statistics which help traders in the decision-making process. Try it now free!
Track NYSE and NASDAQ market breadth divergence directly from your price chart - even on Renko bars! Optimal Breadth seamlessly integrates advance-decline internals with your price chart and plots three intraday divergence types: classic, hidden and micro. Never miss a signal again!
The Volatility Bands indicator attempts to present a way to measure and visualize volatility, using standard deviations (σ) and average true range indicator, and aims to point out areas that might indicate potential trading opportunities. Click to learn more.
Enhance your trading with our point and click Anchored VWAP indicator for NinjaTrader 8. Built as an indicator, not a drawing tool. Features unique point-and-click anchor setting with hotkeys, 3 customizable deviation bands, and 8 VWAP calculation methods. Start your free trial today!
December 2, 2024
Mastering Sideways Markets With Auction Bars and Range Projections
November 19, 2024
Enhancing Your Automated Trading System: Key Insights from Best Pro Trade
November 14, 2024
NinjaTrader New Ecosystem Tools: October 2024 Edition
Enter Email for Updates
 from Indicator Warehouse.png)