Mentor one to one what you'll find inside: 8 hours of live lectures, 4 hours of live backtest, community discord lifetime live weekly backtest, weekly live review, live archive, markup price action, lifetime updates on new concepts, private structure indicator.
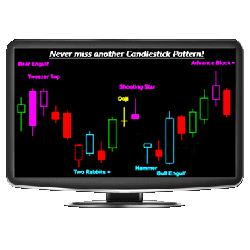
Want to scan for any candlestick pattern, on any timeframe, across any list of symbols? Whether you're interested in the most common or advanced patterns, the Candlestick X-Ray™ detects over 90 unique candlestick patterns, making it a highly flexible and powerful candlestick pattern tool.
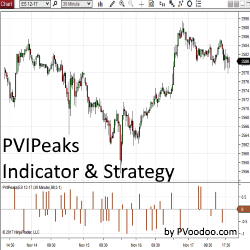
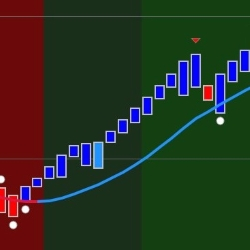
PVIPeaks Indicator and Strategy pinpoints peaks from any standard NinjaTrader indicator and allows traders to use them to generate a signal for an automated strategy. This tool is available exclusively for NinjaTrader 8. Get your free trial today!
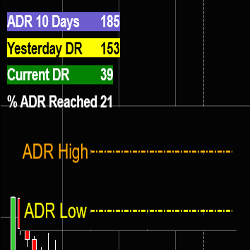
This highly customizable NinjaTrader 8 indicator displays the average daily range allowing users to spot related trading opportunities. T2SSmartADR also provides notifications when the average daily range is reached and when there is a high probability of reversal trades.
Hey Overachiever, I see you! Don’t worry—you’re in the right place. You’ve made a habit of outperforming, so why not arm yourself with the best team to help continue your winning streak? We code (like hackers) and launch (like marketers) your products. Click and schedule a free consultancy call.
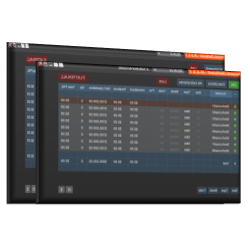
Save money by purchasing the Ultimate Account Management Bundle for NinjaTrader! This all-in-one solution combines their premiere Duplicate Account Actions trade copier and their top-rated Account Risk Manager at a better price!
IATrend gives a clear indication of the trend of any financial instrument and does so on all different time frames.
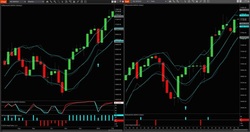
Track NYSE and NASDAQ market breadth divergence directly from your price chart - even on Renko bars! Optimal Breadth seamlessly integrates advance-decline internals with your price chart and plots three intraday divergence types: classic, hidden and micro. Never miss a signal again!
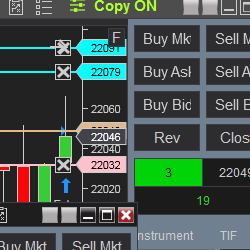
Replicate orders from a master account/master instrument to one or more slave accounts/slave instruments. The Replicator was designed for Micro E-mini trading and managing multiple accounts with a single instance of NinjaTrader 8.
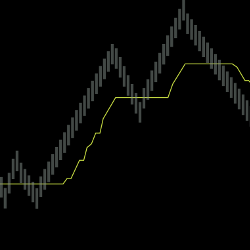
The LogikUltimateRenko is a completely customizable improved variant of the traditional Renko bar type. It has the added options to set the Open Price Relation (to the prior bar), as well as a more precise Reversal Brick Size control. Check out a video demonstration of LogikUltimateRenko in action!
December 2, 2024
Mastering Sideways Markets With Auction Bars and Range Projections
November 19, 2024
Enhancing Your Automated Trading System: Key Insights from Best Pro Trade
November 14, 2024
NinjaTrader New Ecosystem Tools: October 2024 Edition
Enter Email for Updates