The Fibonacci Angle Fan forward plots equidistant Fibonacci trendlines from a single cast point.This provides leading edge Fibonacci Support & Resistance forecasting. Ideal for Price Action traders.Combine with traditional Fibonacci Technical Analysis methods & max tap the Fib Golden Ratio of 1.618%
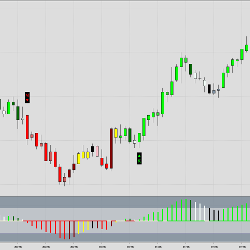
The Zerolag Oscillator is a MACD type momentum oscillator, based on two zerolagging moving averages. The indicator is designed for locating momentum and pullback entries. Momentum entries are found shortly after a trend change, whereas retracement entries focus on the middle chunk of a larger trend.
Learn how to approach an active risk-based portfolio management trading multiple instruments at the same time. You will learn to design a diversified portfolio and equip yourself with the right tools, processes, and mental framework necessary to be successful at managing it. Get your blueprint now!
This workshop will help you decide if trading could be for you. It demonstrates all aspects of trading - managing risk, trading techniques, technical analysis, trading psychology, creating a trading plan and what to include. Join in with your laptop or computer.
Created to help aid momentum-style charting in finding support and resistance lines. It was specifically made for the ES when plotted with tick bars. This tool may help cut down on chart preparation time or get your chart caught back up if busy multi-tasking.
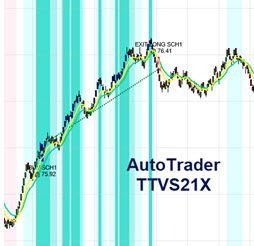
Comprehensive automated system, including 20 strategies, covering a broad range of instruments and market conditions. Includes indicators, color backgrounds and a powerful money management module to protect profit and principal. Lease includes training and support.
Trading requires edge, but in the new world of machine and algorithmic trading disrupting information processing and decision making, it’s incredibly elusive. Boss Trading addresses this problem by introducing professional experience and trader role modelling via live trading masterclasses.
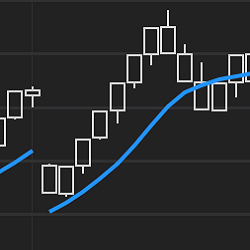
Optimal Filter is a truly unique moving average. It auto-adapts its lookback period for the best responsiveness. It has opening gap filtering technology and is colored, not by slope, but by overall market direction. Strategy compatible.
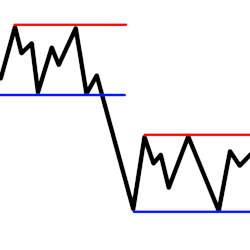
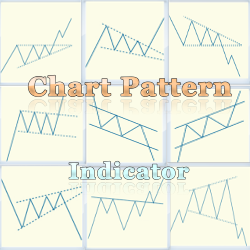
The Chart Pattern Indicator Package includes a number of pattern recognition indicators such as pennant, flag, wedge, triangle and more. The indicators can be purchased separately or discounted as a suite. Learn more!
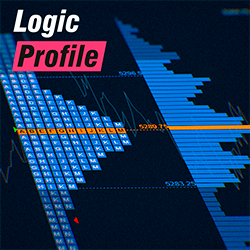
Includes volume profile and TPO market profile, presets for one-click charting, daily, weekly, monthly, date, composite, and drawn profiles. Offers defined or continuous session types and load optimization. All of these features make it one of the most advanced profiles available on the market.
December 2, 2024
Mastering Sideways Markets With Auction Bars and Range Projections
November 19, 2024
Enhancing Your Automated Trading System: Key Insights from Best Pro Trade
November 14, 2024
NinjaTrader New Ecosystem Tools: October 2024 Edition
Enter Email for Updates