Introducing Core Buttons, the ultimate trading tool for split second decision making. These intuitive buttons provide instant access to essential trading functions, enabling you to execute trades, manage positions & adjust orders with a single click. Tailor the customizable options to your trading.
Chompsky Bands: Single and second entry reversal signals and momentum signals, including MACD V5 signals. Includes min/max Bars Per Minute (BPM) filter, Trend Resilience, EMA Tick Separation Filter, Wave Counter. Signal outputs and customizable tags.
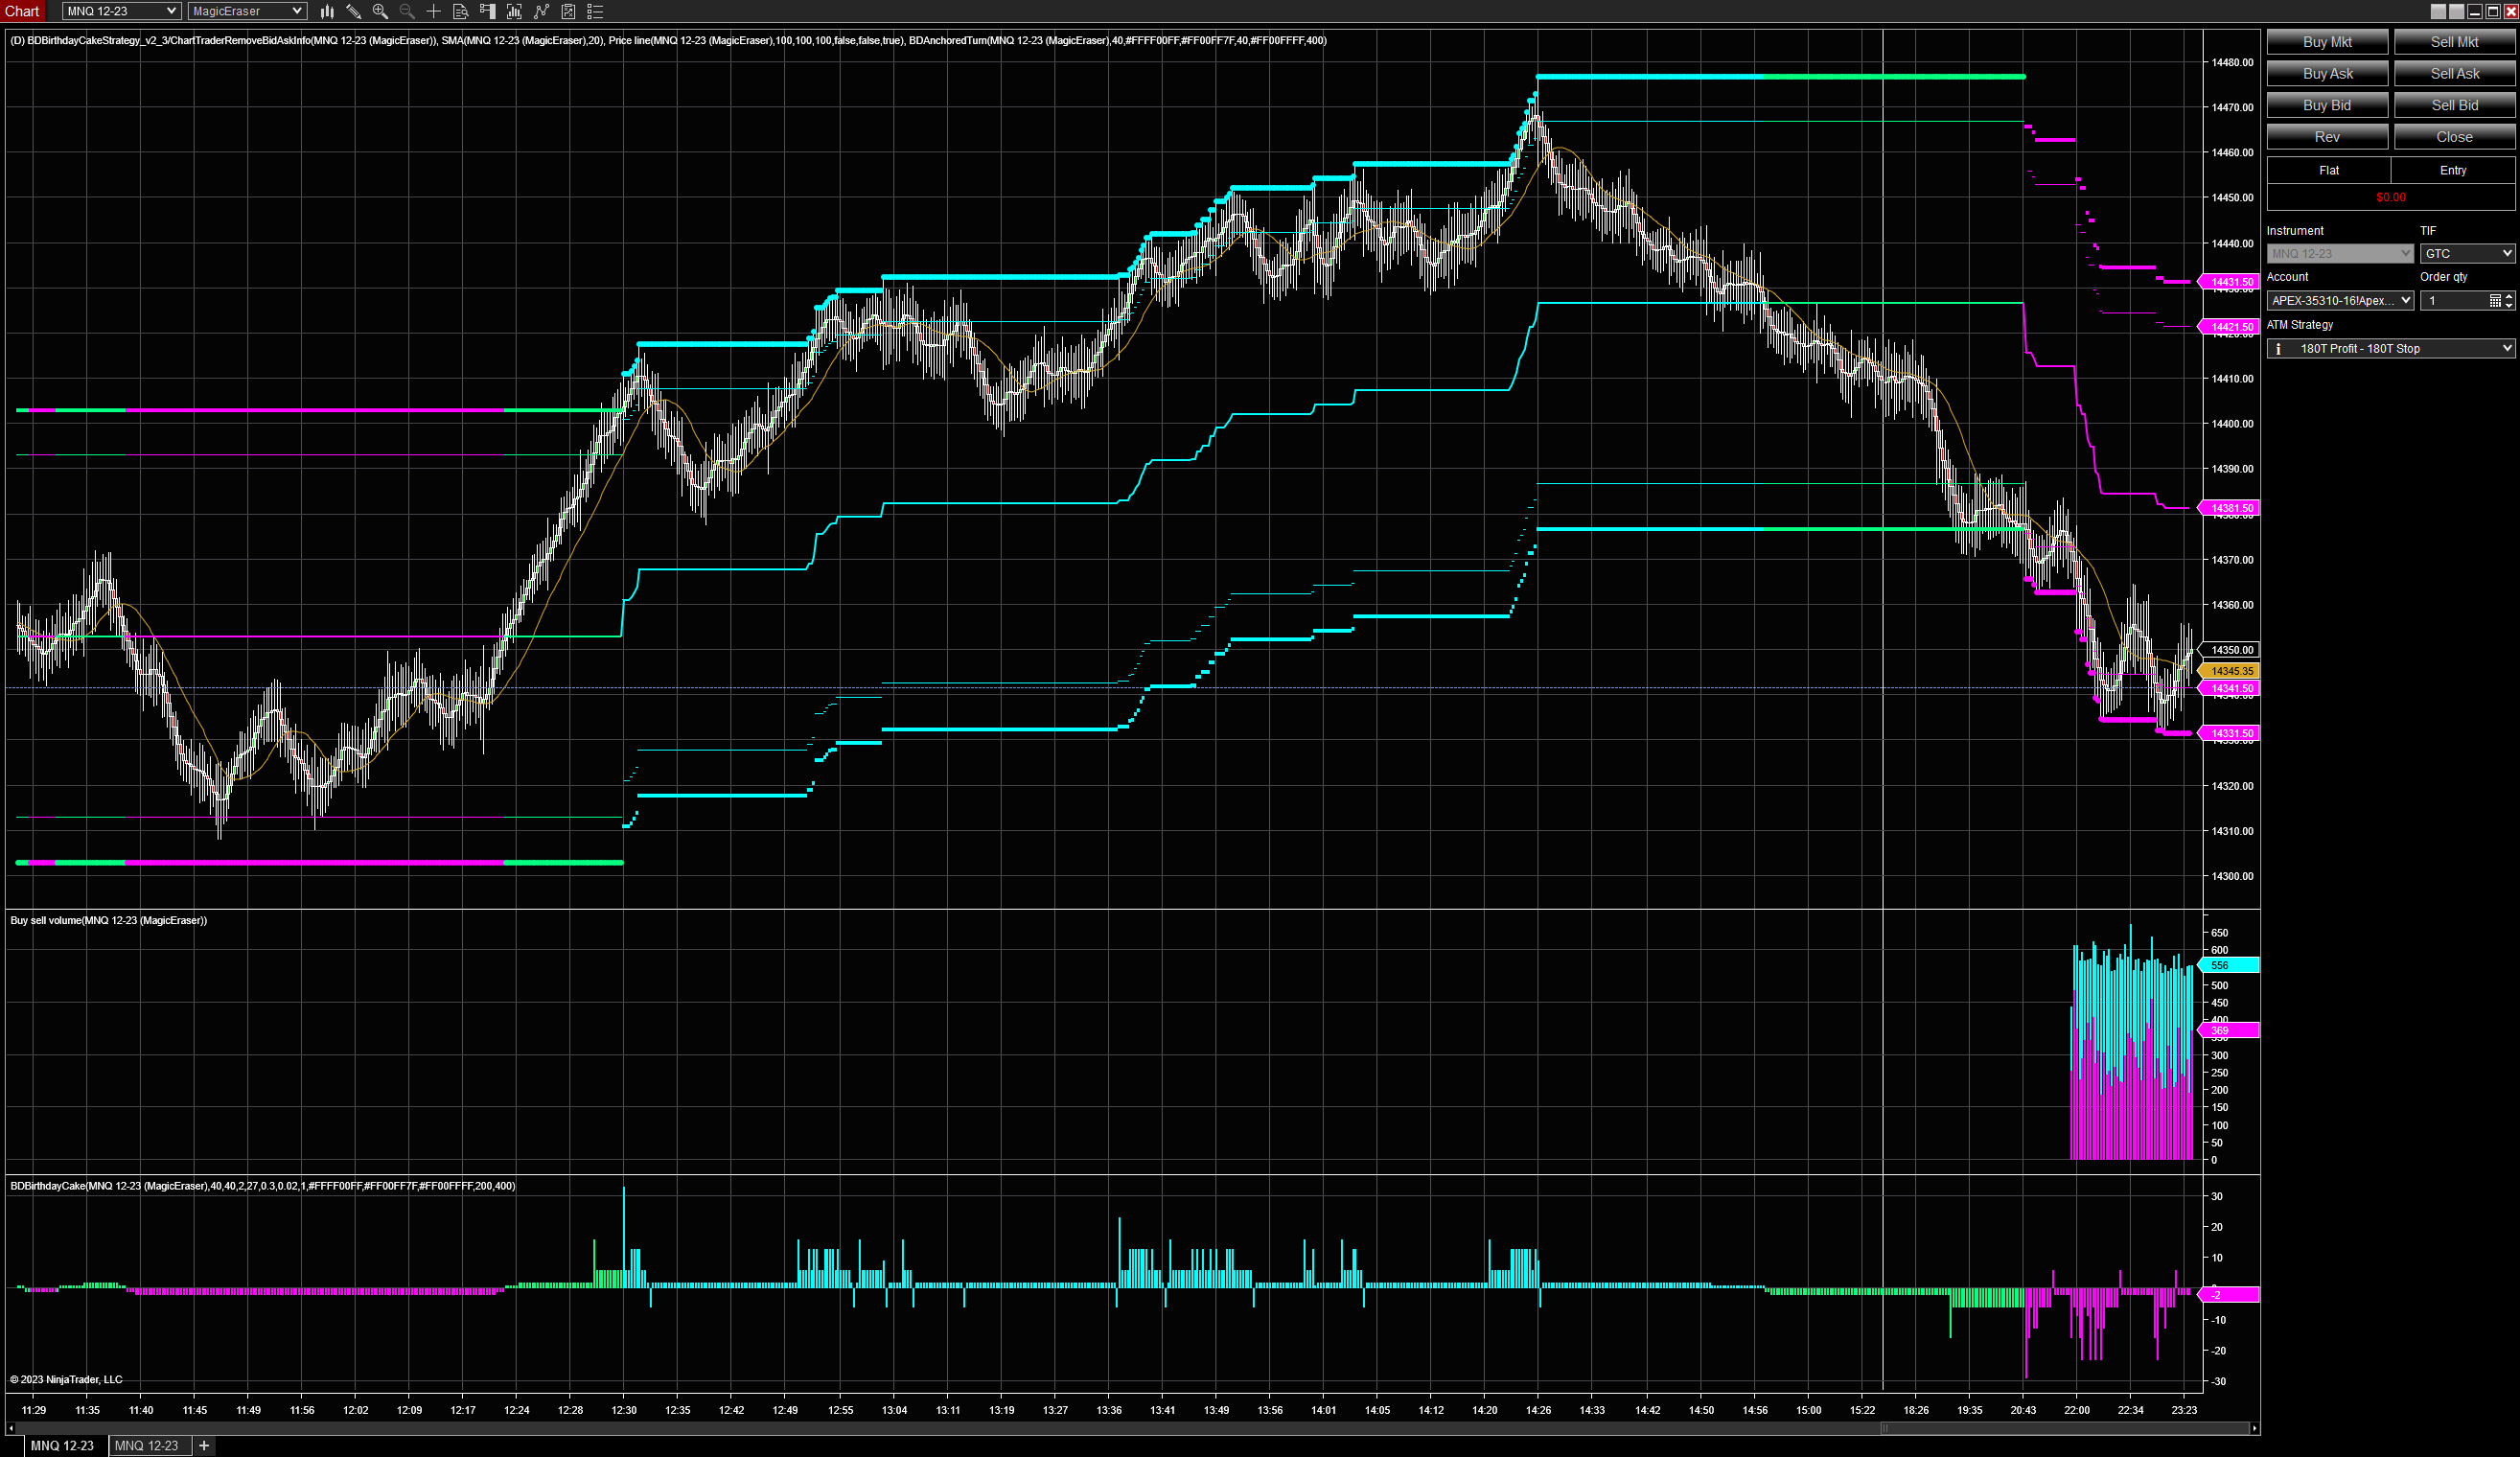
This anchored turn indicator makes it easier to identify the current trend for intraday trading, and provides multiple areas for precise entries. They use it internally for all of their trend based strategies and have been working on new scalping strategies, as well.
Upgrade to the silver plan for enhanced trading capabilities. Get all the features of the bronze plan plus the reference synchronizer module. The reference synchronizer indicator ensures seamless data flow between different charts, including market profile, daily, weekly and monthly charts.
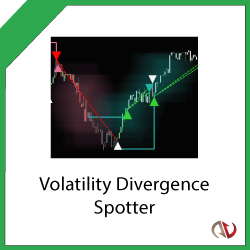
Spot the calm before the storm for both breakouts and breakdowns with this ultimate volatility indicator! Spot bullish accumulation and consolidation points before strong upward breakouts and continued bullish trends. Find points of failing strength at plateaus and tops before drops.
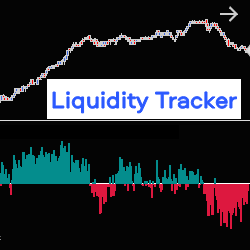
The Liquidity Tracker allows you to monitor, in real time, liquidity variations in the Order Book (pending orders at Bid & Ask), on one or two correlated instruments, at the same time. It therefore allows you to follow the evolution of the market based on the strength of supply or demand.
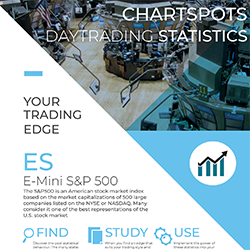
Use Statistics to determine intraday High Probability Targets and place stops outside of the regular market noise. This includes Stats on Initial Balance, Mid, Session & Extension ranges, as well as 1-minute rotations & many more! Available for ES, NQ, FDAX & FESX. Download your free report now!
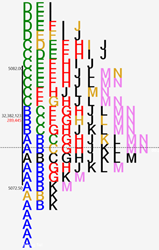
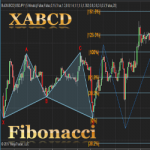
XABCD 5-point chart patterns are very common and popular in technical analysis. As the name suggests, XABCD pattern has 5 points and 4 legs formed by those 5 points. The concept of the XABCD 5-point pattern can be understood on a chart.
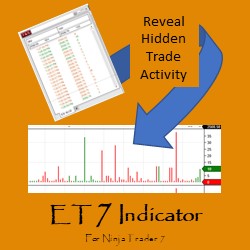
Elephant Tracks Software’s ET 7 allows traders to select just the trade sizes they want to see, revealing hidden patterns. This advanced Time & Sales information can be highly beneficial for individual traders to understand institutional trading behavior. Get started with a 2-week free trial!
Complete your NT Fibonacci Toolbox with a designated Fibonacci Fan. Effortlessly forward plot support & resistance, trendlines, speedlines & confluence checks with traditional Fibonacci retracement analysis at 23.6%, 38.2%, 61.8%, 76.4% & 86.6% (+50%). Custom create other watch levels if required.
December 2, 2024
Mastering Sideways Markets With Auction Bars and Range Projections
November 19, 2024
Enhancing Your Automated Trading System: Key Insights from Best Pro Trade
November 14, 2024
NinjaTrader New Ecosystem Tools: October 2024 Edition
Enter Email for Updates