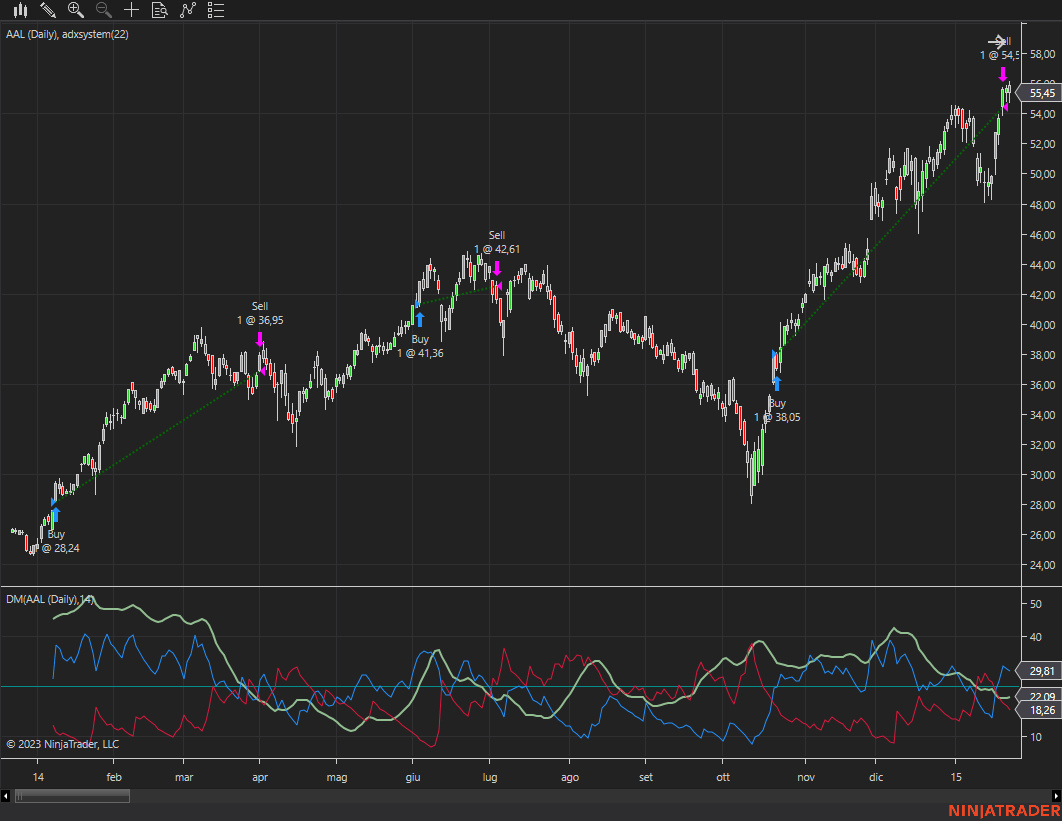
ADX trading system detecting price direction as well as trend strength.
Thapelo FX Knight Trading Academy is a trading training academy, helping amateur to middle traders gain their consistency in the trading industry.
Whether you are an absolute beginner, or an advanced trader, this course if for you. The Professional Trading Course is a comprehensive training program or serious traders consisting of 22 video lessons, a robust trading system plus ongoing support.
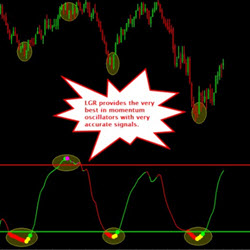
The LGR is a composite Triple Momentum Index Oscillator. LGR indicator is a proprietary design that gives the trader the crème de la crème of momentum oscillators by combining into a single indicator. No more figuring out which oscillator to choose.
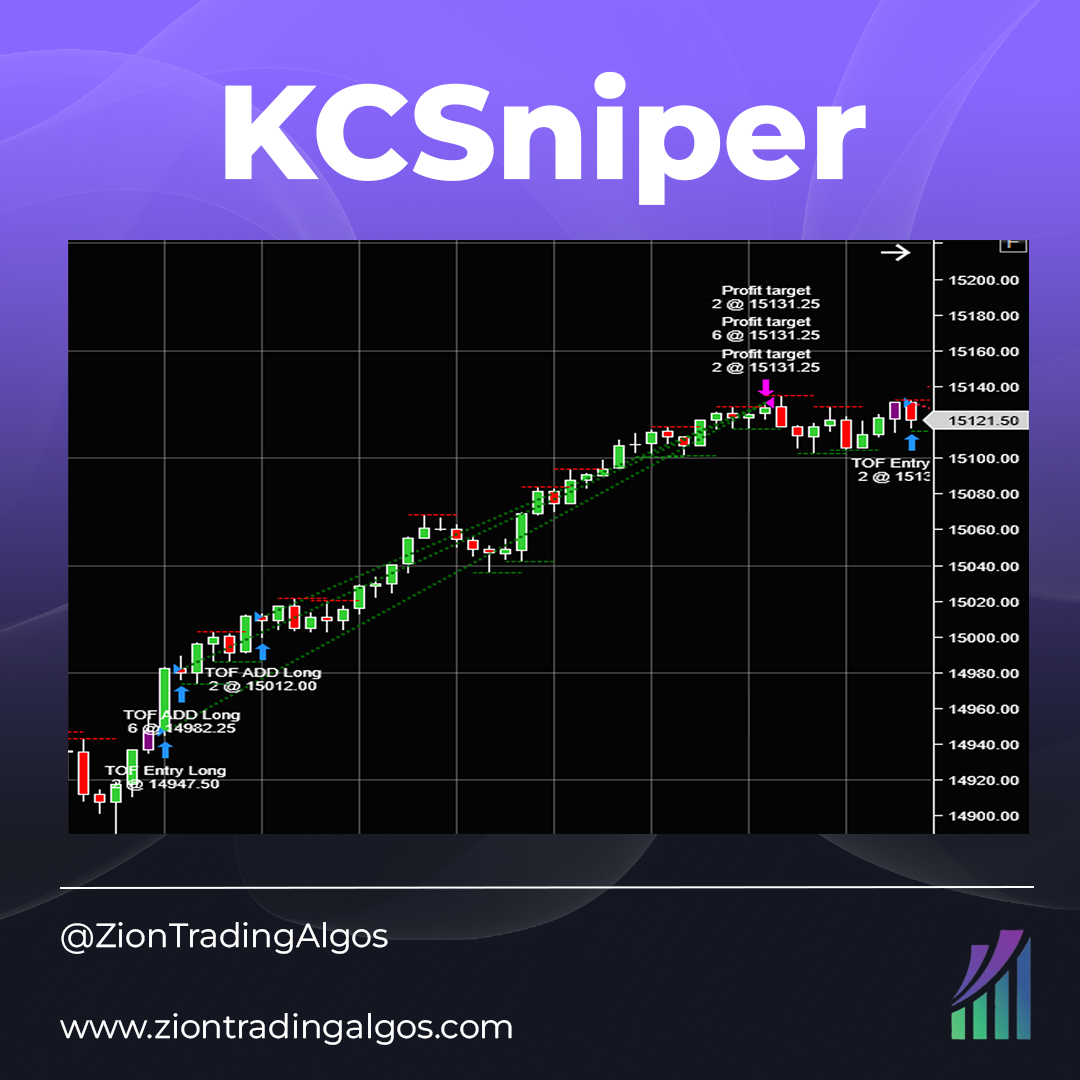
KCSniper is a Keltner Channel-based system on the 10-minute chart. It is long only and does not pyramid into positions, but has a single entry and exit model. It uses volatility based stop loss and take profit targets to remain adaptable. Trades MES and MNQ.
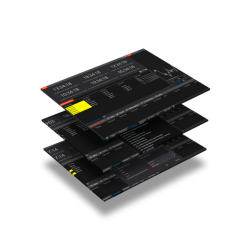
Explore the vibrant world of NinjaTrader 8 Add Ons – a treasure trove of powerful tools crafted to elevate your trading game. Dive into an array of clocks, indicators and utilities designed to amplify your market analysis, fine-tune strategies and execute trades with precision.
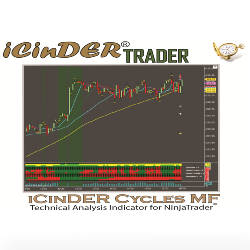
The iCinDER™ MF (Market Forces) includes all of the iCinDER™ family of indicators as part of a complete set. The analysis is based on internal market force of the instrument being analyzed. Learn more!
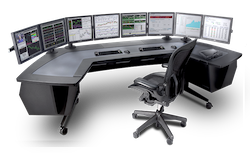
Immerse yourself in a dynamic trading environment with AmerTd's On-Site & Virtual Trading Rooms. Equipped with the latest technology and real-time market data, this state-of-the-art facility offers a collaborative space for traders to execute strategies and maximize their potential.
The Smart Momentum NinjaTrader Indicator tool has a unique design compared to other momentum indicators. It uses an averaging mechanism that analyzes the cycle and adapts to it. This results in a momentum plot that is simultaneously smooth and sensitive.
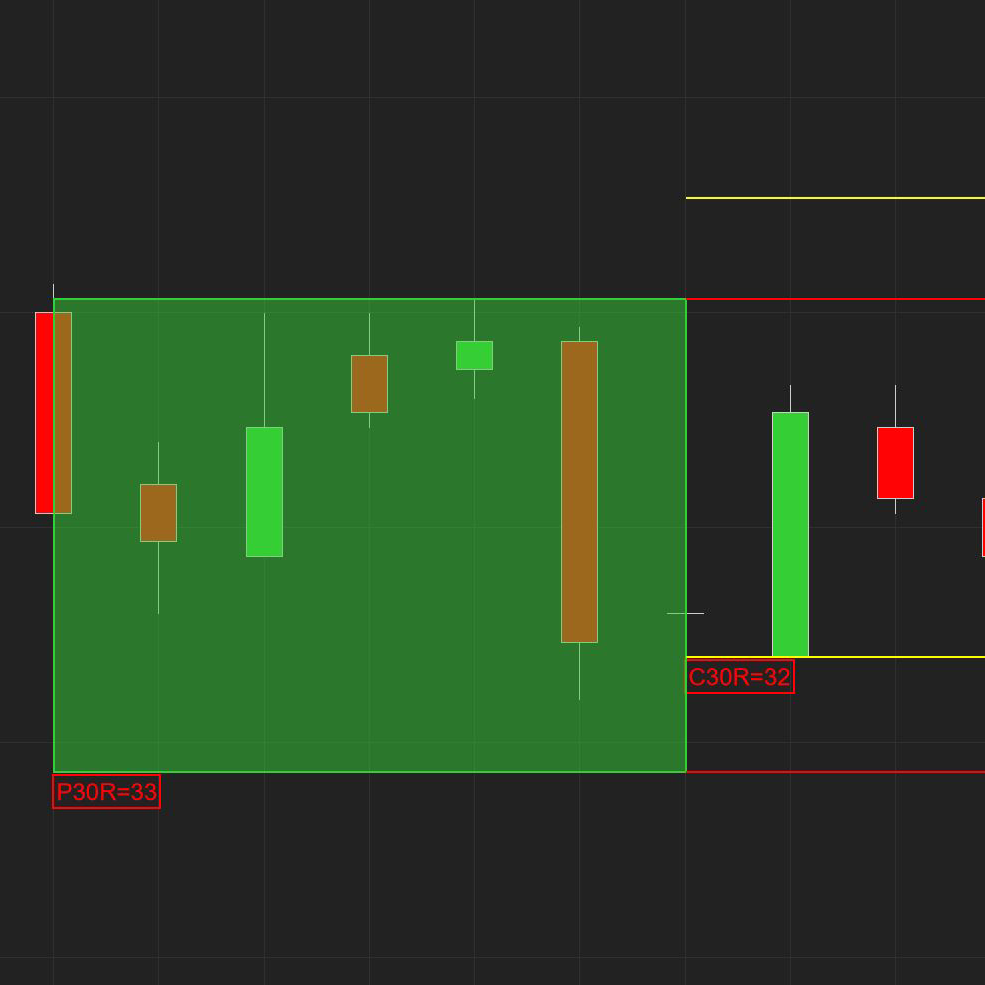
The purpose of the Free 30-Minute Range Indicator is to display visually the Previous 30-Minute Period and the Current 30-Minute Period's relationship to the previous period.
December 2, 2024
Mastering Sideways Markets With Auction Bars and Range Projections
November 19, 2024
Enhancing Your Automated Trading System: Key Insights from Best Pro Trade
November 14, 2024
NinjaTrader New Ecosystem Tools: October 2024 Edition
Enter Email for Updates