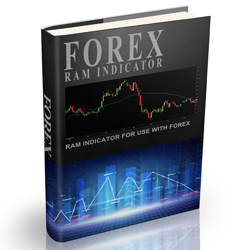
PriceIsKing.com's Forex RAM Indicator saves traders time finding entries and eliminates emotional factors. The algorithm is based on years of research and programming. This powerful tool shows entry points when the right condition is met. Get started with a free 2-week trial today!
The Atlas Line begins plotting soon after the market opens. As it grows throughout the day, you will see entry signals (long and short) as well as supplemental "strength" and "pullback" signals. Many traders use the Atlas Line for its powerful signals and a big picture of anticipated price action.
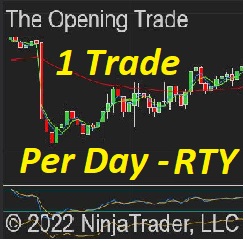
With a potential of 1 trade per day, this system is automated from start to finish & designed to be monitored in some capacity. If you can remotely access a computer with the right software, then you can monitor these automated trades from the golf course (with a strong cell signal).
Do you want to know the trading setups we use? Create your own profile FREE on our website and you’ll have access to our course videos where we explain each of our patterns. Gain the knowledge to access our EPyF Trading Room and learn our way of understanding the market.
A comprehensive Automated System including 20 strategies covering a broad range of instruments and market conditions. Includes indicators, color backgrounds, and a powerful money management module to protect profits and principal. Learn more.
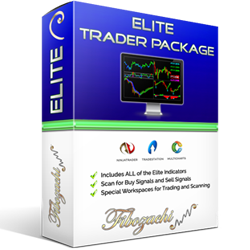
Simplify your trading process! The Elite Indicators predict major tops and bottoms, diagnose the direction and strength of price action, and calculate the best stop-loss and profit-target levels! Try a 30-day demo today!
This free package includes Symbol Watermark, which shows the name of the symbol and time frame directly on the chart; Trader Limit, which limits trading when the daily loss level is reached; SR Dynamic Lines (dynamic resistance zones); and many other useful tools. These products are free for life.
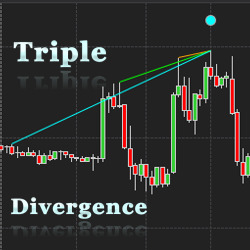
When three continuous divergences occur the WilliamsR Triple Divergence Indicator will trigger an entry signal at the current bar. This indicator integrates with NinjaTrader’s market analyzer and indicates either bullish or bearish divergence at x number of bars ago.
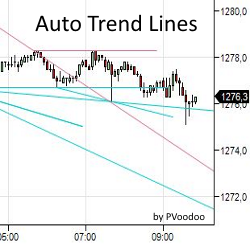
The PVAutoTrendLines allows traders to see lines within market highs and lows and automatically extrapolate the data into support and resistance levels. Traders can use this data for entry/exit signals or within automated strategies. Learn more!
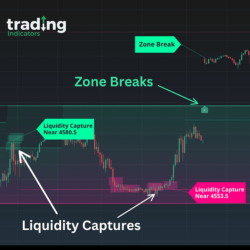
With Liquidity IQ, you have a personal "Technical Analysis" trading assistant by your side, dedicated to highlighting critical trading levels and trends. And the best part? It works continuously, updating in real-time as the market changes.
December 2, 2024
Mastering Sideways Markets With Auction Bars and Range Projections
November 19, 2024
Enhancing Your Automated Trading System: Key Insights from Best Pro Trade
November 14, 2024
NinjaTrader New Ecosystem Tools: October 2024 Edition
Enter Email for Updates