According to your technical plan, Advanced Software Features will implement a trading idea or an indicator idea using the C# computer code and the NinjaTrader 8 terminal. With the help of additional mathematical libraries, they will be able to develop complex trading algorithms with you.
2 Cores (Intel Xeon E-3.70GHz), 4GB DDR4 RAM, 40GB NVMe SSD, 1x Dedicated IP address, Windows 2019, Free Installation, Unlimited Traffic, RDP/iOS/Android/Mac/Parallel access, Supports All FUTURES Platforms, CLOUD Anti-Virus & Malware Protection, Immediate Activation
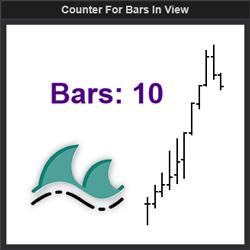
This indicator displays the number of bars in view along with visual reminders if the user is over a defined limit. This increases application functionality and user charting efficiency.
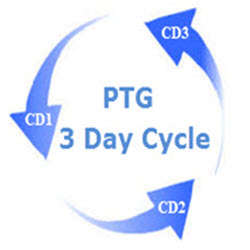
3 Day Cycle (a.k.a. Taylor Trading Technique) was invented by George Taylor. His core premise was that the market is manipulated in stages. Now traders have access to an “Electronic Trading Book” via spreadsheet emailed daily.
A comprehensive package for both beginners & intermediate traders. It has been designed to help you towards building or understanding strategy construction. This will help you trade sustainable, scaleable and reproducible strategies with conviction to achieve consistent performance.
In this course you will learn how to trade the following chart patterns: Trendline strategies, candlestick patterns, chart patterns, Elliot Wave Theory, harmonic patterns, risk management, trading plan, trading psychology and more.
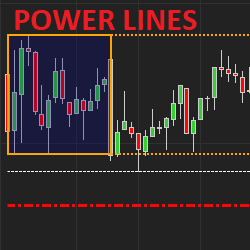
The itcPowerLines indicator displays important intraday support/resistance levels for stock traders (Opening range, morning H/L, yesterday H/L, Weekly H/L, daily SMA/EMA). Colors, styles & width are customizable. Users can also define which elements to display including levels for past days.
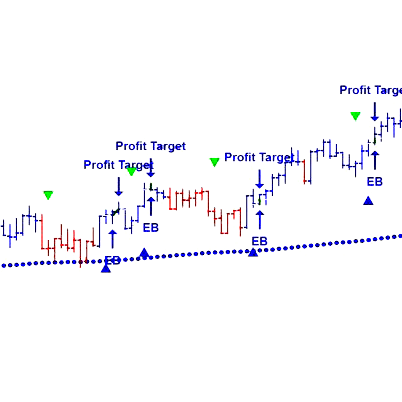
This fully-automated reactionary price and volume intraday trading strategy takes advantage of fluctuations of price, direction and momentum to currently trade the E-mini indices. We will be expanding into other futures, commodities and chart intervals in the near future.
GAP/VWAP Fail is one of Scott's favorite stock setups that can be also applied to futures. A frequent & highly favorable risk-reward play that finds an additional edge by understanding order flow, watch Scott explain it in detail & demonstrate with multiple examples including entry & exit rules.
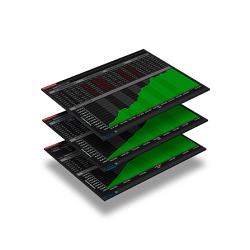
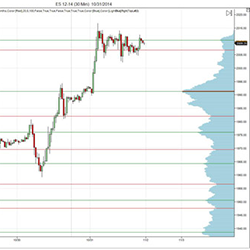
A1VolumeProfile is an easy way to add intraday and composite volume profiles to any chart. High and low volume nodes can indicate high probability areas for price predictability, and value areas indicate high probability areas for potential intra-day trend changes. Download a free trial!
December 2, 2024
Mastering Sideways Markets With Auction Bars and Range Projections
November 19, 2024
Enhancing Your Automated Trading System: Key Insights from Best Pro Trade
November 14, 2024
NinjaTrader New Ecosystem Tools: October 2024 Edition
Enter Email for Updates