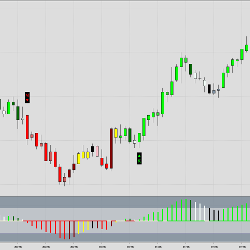
The Zerolag Oscillator is a MACD type momentum oscillator, based on two zerolagging moving averages. The indicator is designed for locating momentum and pullback entries. Momentum entries are found shortly after a trend change, whereas retracement entries focus on the middle chunk of a larger trend.
TradeFoxx is an automated trading software designed for the NinjaTrader Desktop platform, version 8. It supports trading in Forex, Futures, and Equities, and offers full automation with time frame control. A free 30-day trial is available, allowing you to test the product before making a purchase.
Our automated trading system features scalping, swing trading, automatic entry & exit signals and price action-based trading. With no optimization required, the Best Pro trade systems are based on statistical analysis and algorithms based on advanced mathematical computations.
The platform is responsible for finding multiple patterns in operations and provides statistics which help traders in the decision-making process. Try it now free!
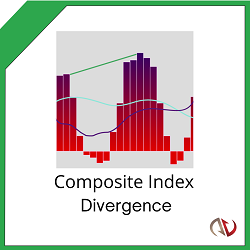
See trend reversals before they happen with intelligent divergence signals! Predict the trend ahead of the crowd with precise entry and exit points. This innovative indicator uses momentum calculations to warn of trend reversals before they happen!
RTMC MNTrader is a fully automated trading system. Trading is based on Renko strategy using an exponential moving average. Filtering system based on the MACD and TMA Slope indicators. It has an improved position support system with flexible settings that will improve trading consistency.
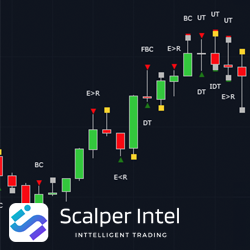
This indicator focuses on identifying the Sign of Strength (SOS) and the Sign of Weakness (SOW) for you and plots them on the Chart. This indicator also studies "The Next Bar" to confirm/refute SOS/SOW.
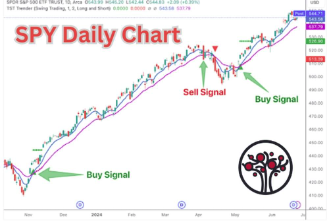
Serge Berger’s TST Trender indicator is designed to provide buy/sell signals at near-term turning points in stocks, ETFs, and futures. At its core, it uses a moving average crossover strategy with specific moving averages that have proven to work best on the daily charts (for swing trading).
Become a pro trader with our 26 chapter Price Action Trading Course. Step by step guides showing you how to find signals, set up your chart,find trends,when & when not to trade & much more. Includes lifetime membership,live daily analysis,chatroom & weekly analysis video sent directly to your inbox.
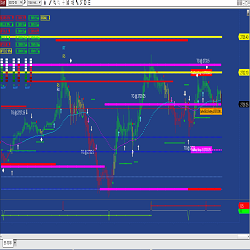
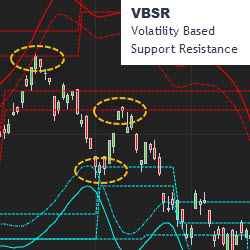
MetaSwing plots the hidden structure of support and resistance in real-time. VBSR (volatility based support resistance) makes this visible in advance, in all timeframes. Markets are non-linear and your tools should be as well. It’s not your father’s TA. Trial MetaSwing.
December 2, 2024
Mastering Sideways Markets With Auction Bars and Range Projections
November 19, 2024
Enhancing Your Automated Trading System: Key Insights from Best Pro Trade
November 14, 2024
NinjaTrader New Ecosystem Tools: October 2024 Edition
Enter Email for Updates