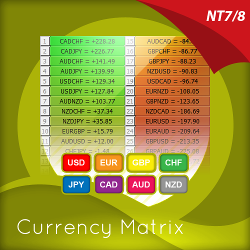
The currency matrix indicator is a simple solution to a complex problem, revealing sentiment for the currency across the currency complex. Now traders can know when they're trading with the universal flow, not against it. Learn more about this unique Forex indicator for NinjaTrader!
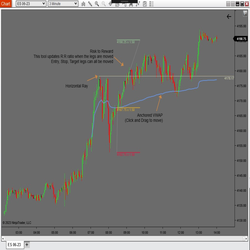
PureAlgo has developed a set of drawing tools to assist you with trading, including Anchored VWAP, Risk Reward PA and Horizontal Line. The package includes all of the tools and is priced at $10.
Start with an idea, work with our development team and then test your strategy. If it functions well, next deploy the strategy in paper trading mode and track each day’s performance. We provide support in Portuguese.
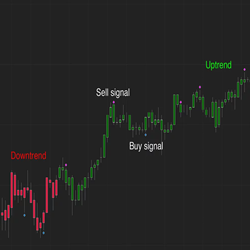
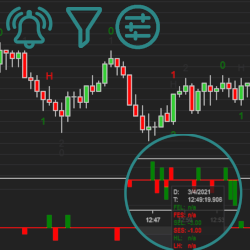
The Q-Indicator provides visual signals of overbought or oversold conditions in the market. Users can enter trades manually or use the indicator in an automated system to take advantage of the various market imbalances.
Alerts on two-legged pullback status. Fourteen price action signals: second entries, higher low, lower high, failed 2E, etc. Five filters and preferences: reset on double top, engulfing bars, risk limit, etc. Precise counting of second entry, Mack’s technique. Flexible setup. Start a free trial now.
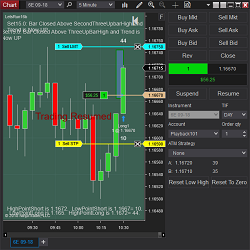
Let’s Run is a breakout strategy used for discretionary or automated trading with a Chart Trader switch. It triggers based on built-in trend finding indicators with customizable settings for stop options and reset buttons. It is fully flexible with both swing and scalp capabilities. Learn more!
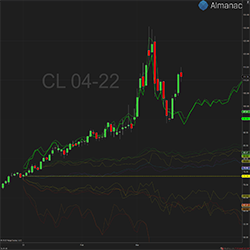
Accrue Inc. didn’t invent seasonality – they just made it easier to see and trade! Almanac™ Calendar Analytics creates better awareness of seasonality with 90-day price projections across five different market scenarios.
Indonesian-speaking. This channel is a place to learn forex, crypto and stock trading using ICT methods. Make daily analysis, design trading plans correctly and measurably.
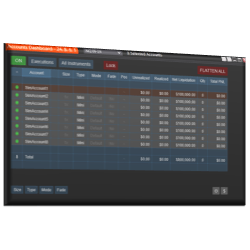
Duplicate Account Actions is the premiere NinjaTrader trade copier solution, built to keep all your positions and orders across all accounts in sync at all times. Finally, eliminate stress and challenges related to issues from other trade copier solutions!
daVinci is a hands-free, short-term, mean reversion, auto-ex trading algorithm, recommended for day trading the world's most liquid traded markets. These include CFDs, Cryptocurrencies, ETFs, Equities, and Forex and Futures markets that are listed and traded on the various regulated exchanges.
December 2, 2024
Mastering Sideways Markets With Auction Bars and Range Projections
November 19, 2024
Enhancing Your Automated Trading System: Key Insights from Best Pro Trade
November 14, 2024
NinjaTrader New Ecosystem Tools: October 2024 Edition
Enter Email for Updates