Learn how to identify institutional algorithms and trade like the pros! This course for experienced/advanced traders will take you through advanced strategies and preparations for trading index futures. Traders who purchase this course will also gain access to private slack channels.
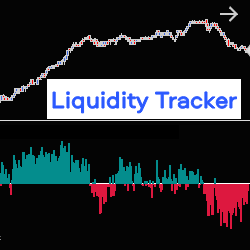
The Liquidity Tracker allows you to monitor, in real time, liquidity variations in the Order Book (pending orders at Bid & Ask), on one or two correlated instruments, at the same time. It therefore allows you to follow the evolution of the market based on the strength of supply or demand.
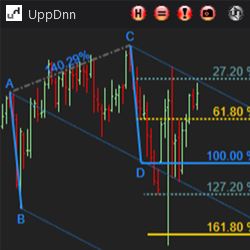
The Symmetry Drawing Tool helps quickly analyze symmetrical market movements by simply drawing a line from point A to point C. Add Fibonacci levels, customize appearance, add Andrew's Pitchfork with customizable levels and output a potential reversal area based on swing pattern logic!
Learn everything you need to know about charts and technical analysis to become consistent in the markets. This course includes basic structure, support/resistance, trend, supply/demand, Fibonacci, change control zones, divergence, trading psychology, and putting it all together.
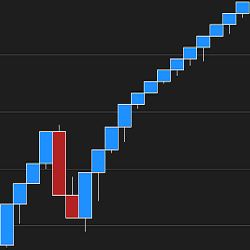
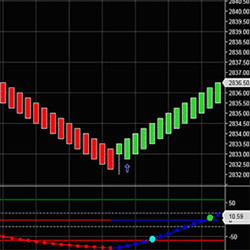
Say goodbye to fixed brick sizes! Optimal Renko Bars' advanced logic auto-selects the smoothest-fit Renko bars for your chart in real time! Dynamic, self-adjusting bar type that responds to today's market.
Automated trading for the S&P 500, Indices, ETFs, Stocks and Cryptocurrencies. Discretionary trading indicators. The RD3 uses a two stage system for identifying profitable swing trading opportunities.
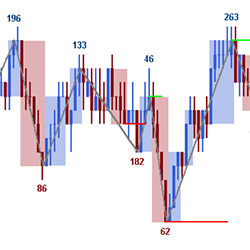
The MAutoFloorCeiling indicator is the culmination of over 2 years of research to determine support / resistance levels automatically. The heart of it utilizes a powerful algorithm based on Wyckoffian concepts of waves, volume, and price levels to gain insight on potential entry points.
The Line Break Bar is one of the most effective ways to reduce chart noise. It provides accurate back-testing results by showing the correct open prices and restoring the wicks. Easily recognize divergence & price action patterns & eliminate noise from traditional minute charts. Get started today!
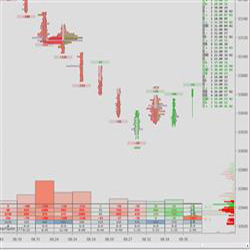
An easy-to-use order flow and volume profiling tool for NinjaTrader 8. The goal is to present order flow in a simple, clear way that also performs well in volatile markets. Numbers are not key here, visuals are. Algo helpers and trade execution assist included. Always evolving! Trial available.
TrendLine Indicator plots red and blue lines to determine the trend. Easily detect the trend direction in any markets so you can easily find ideal trade setups. The red and blue arrows confirm the trend directions and plot above and below the candles.
December 2, 2024
Mastering Sideways Markets With Auction Bars and Range Projections
November 19, 2024
Enhancing Your Automated Trading System: Key Insights from Best Pro Trade
November 14, 2024
NinjaTrader New Ecosystem Tools: October 2024 Edition
Enter Email for Updates