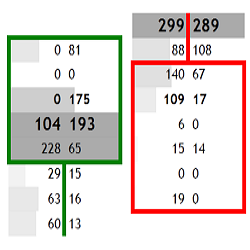
Volume Ladder allows traders to display bar intrinsic, tick level volume and bid-ask information in neat and clean format. Various visual customizations are available to suit a variety of uses. This is an essential tool for order flow analysis, and market/volume profile structure traders.
HelloWin Backtest is a revolutionary trading analysis tool offering an intuitive PnL graph for real-time system evaluation. Supporting various bar types, slippage adjustments, and a unique two-round logic for defining entries, it mirrors the strategic approach of professional traders.
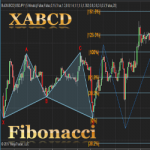
XABCD 5-point chart patterns are very common and popular in technical analysis. As the name suggests, XABCD pattern has 5 points and 4 legs formed by those 5 points. The concept of the XABCD 5-point pattern can be understood on a chart.
Complete your NT Fibonacci Toolbox with a designated Fibonacci Fan. Effortlessly forward plot support & resistance, trendlines, speedlines & confluence checks with traditional Fibonacci retracement analysis at 23.6%, 38.2%, 61.8%, 76.4% & 86.6% (+50%). Custom create other watch levels if required.
This ultimate package provides high-quality, reliable signals with quick, easy, and precise order entry. Agile Piranha Scalping generates rapid, high-frequency signals, swiftly executed within a small market range. It elevate your scalping with efficiency and reliability.
Everything you need to know about consistent trading video tutorial course. This course covers the following: How to use the Metatrader4 trading app, market Analysis (Fundamentals & Technicals), risk management, trading psychology (trading plan, journal, management, goal, etc.)
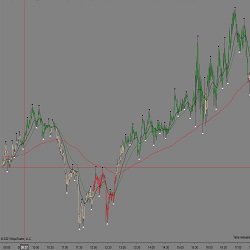
Trend Friend is a simple indicator designed to identify when the price in different time periods is aligned with select moving averages. It is not a closed methodology to operate but you can establish two systems to use this indicator: aggressive operation to paint signals or wait for a retracement.
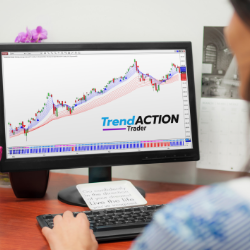
Trend Action Trader keeps you on the right side of the market with clear high probability signals for all markets and timeframes. Its price patterns and momentum algorithm are ideal whether you trade short or long term. Improve your trading consistency - try risk-free for 30-days!
The ROC/Wave Velocity is a bundled package with a momentum indicator including 10 types of averages with 3 oscillator inputs driven by 3 price options. It provides an added layer of discovery into the price action by measuring the acceleration/deceleration of price and the relative trajectory.
The system looks for the highest high and lowest low over past bars, then the system tags the entry with a line that is proportional to your entry settings. Then the strategy calculates: Imbalance, velocity, momentum and probability.
December 2, 2024
Mastering Sideways Markets With Auction Bars and Range Projections
November 19, 2024
Enhancing Your Automated Trading System: Key Insights from Best Pro Trade
November 14, 2024
NinjaTrader New Ecosystem Tools: October 2024 Edition
Enter Email for Updates