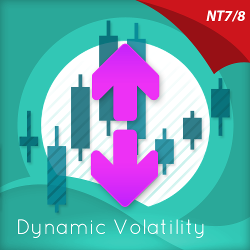
The Quantum Dynamic Volatility indicator paints volatility as price action unfolds - no more guesswork, no more nasty shocks. Watch and wait, then trade with this safety-first indicator!
IAStealth signals the entry when the shorter time frame momentum has reversed back in the direction of the trend. More important is to know when the longer time frame momentum is showing signs of reversing. IAStealth alerts the shorter time frame after IAMomentum/IATrend alert the longer time frame.
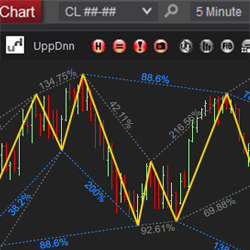
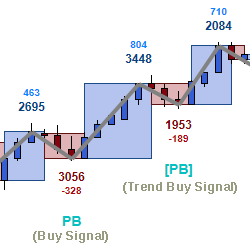
The Swing Toolkit is a collection of swing analysis tools designed to make trading faster and more consistent. Swing Pattern Trading utilizes the recognition of specific price patterns and the alignment of exact Fibonacci ratios to determine possible reversal points in the financial markets.
Custom program your own indicators / strategies / add-ons / tools for NT8. We custom program fully or semi-automated strategies, indicators, add-ons and tools based on your requirements. All source code delivered with additional free tech support after delivery. Get a free, no-obligation quote now!
Ocean Theory considers all time frames simultaneously, and lets the market tell you which ones have the most significance, since that changes with time. Determine trend, pinpoint end of counter-trend moves for optimal entries, and apply natural moving averages. Sign up for a 30 day free trial!
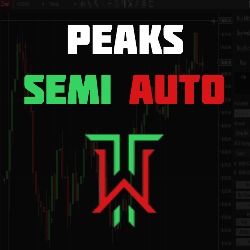
The ultimate semi-auto trading strategy that harnesses the power of a premier indicator, Peaks. This innovative tool gets you into trades, automatically as a signal is generated, eliminating the need for manual entries. Peak's Semi Auto also offers automated exits, using their custom Auto PT logic.
The MCumulativeDelta Indicator shows the bid / ask volume displayed in a histogram over a period. It serves to determine whether supply or demand is dominating and in control and the buying / selling pressure.
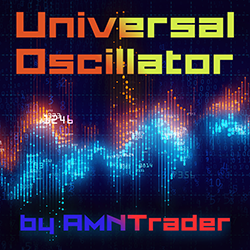
Universal Oscillator is an indicator that operates on the general principles of the RSI, CCI and OsMA oscillators. It helps you to identify potential upcoming reversals based on the values of the oscillator.
PoshTrader is a fintech company based in Estonia that specializes in custom development and out-of-box solutions for traders. We convert, retain and increase the lifetime value of trading platforms. Our work focuses on enhancing the trader's experience and performance.
NinjaScript development covering the full range of capabilities in NinjaTrader 7 & NinjaTrader 8. QTradez develops custom indicators, strategies, bar types, SuperDOM columns and more to enhance Add On functionality. Fixed pricing is available for well-defined projects! Get in Touch Today!
December 2, 2024
Mastering Sideways Markets With Auction Bars and Range Projections
November 19, 2024
Enhancing Your Automated Trading System: Key Insights from Best Pro Trade
November 14, 2024
NinjaTrader New Ecosystem Tools: October 2024 Edition
Enter Email for Updates