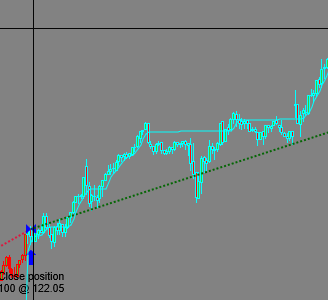
A trend following tool that can achieve exceptionally high risk/reward ratios when applied to suitable markets that trend well. Locks onto trends and does not let go until the trend ends. Not entirely suitable for novices. Strategy, paint bar and indicator included. Automated or manual operation.
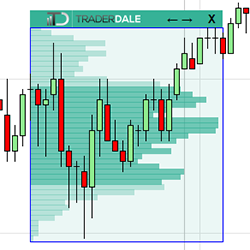
TD’s Flexible Volume Profile helps to reveal institutional trading activity and identifies the strongest support and resistance zones. The use of tick volume data makes it extremely precise leading to potential entries. It is easy to learn, simple to use, and extremely intuitive.
Custom program your own indicators / strategies / add-ons / tools for NT8. We custom program fully or semi-automated strategies, indicators, add-ons and tools based on your requirements. All source code delivered with additional free tech support after delivery. Get a free, no-obligation quote now!
PriceIsKing.com's Stocks RAM Indicator is a powerful tool based on years of research and testing that shows equities traders entry points with arrows when the right condition is met. Get started with a free 2-week trial today!
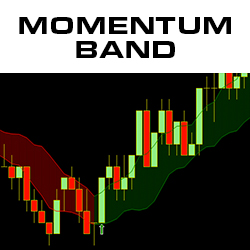
The Momentum Band indicator shows the trend and takes the noise out of the market, keeping you in trades longer, as you won’t get shaken out by temporary price fluctuations. Color changes and arrows indicate significant changes in momentum. Stay in Trades Longer & Download the Momentum Band Today!
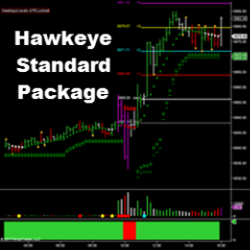
Hawkeye Standard Package is Hawkeye Traders' most popular indicators, providing trend and volume analysis across multiple markets. These powerful indicators tell traders when a trend is commencing, in congestion, and where to find the correct exit. Buy now using code: “NT10Off” for a 10% discount!
Backtest & forward test with the easy to use Strategy Tester. Develop your strategy for futures, forex, or equities markets. Test profit targets, stop placement, trading times, entries and exits in real time. This product includes unlimited support and a free class!
The SDP History offers multiple ways for the user to visualize the aggressive auction from session to session and monitor for continuation (Leroys) and turning points (Elbows).
Daily trade strategy briefing (S&P 500 e-mini (ES) and Nasdaq 100 (NQ) futures). Two-week free trial. This daily email report is published "pre-RTH" session so traders can be prepared and have an actionable trade strategy plan with relevant probability price targets for the current session.
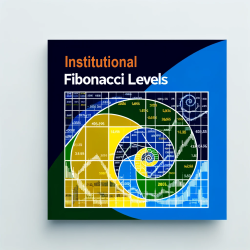
Fibonacci LevelsL Institutional Support and Resistance Levels by DTB Traders offer unparalleled accuracy for futures market trading. With automatic adjustments for new highs and lows, save hours on analysis across multiple instruments and time frames.
December 2, 2024
Mastering Sideways Markets With Auction Bars and Range Projections
November 19, 2024
Enhancing Your Automated Trading System: Key Insights from Best Pro Trade
November 14, 2024
NinjaTrader New Ecosystem Tools: October 2024 Edition
Enter Email for Updates