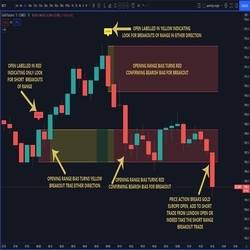
Defines the opening ranges of major markets, gold and oil pit opens, and major data points. The range has a cloud which automatically changes color depending on the market bias and continues until the open the next day. This allows for multiple entries of breakouts throughout the following 24 hours.
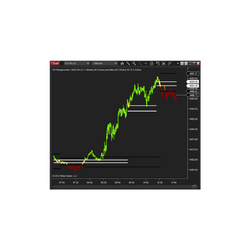
CB RangeLevels 2.0 can be used both for support and resistance and for breakout / momentum trading. The main idea is to keep you with the trend to the upside or downside. Trade in the direction of the painted bars using the middle bars as support and resistance.
The market efficiency is an oscillator-based gauge which monitors bid and offer information in an adaptive sequence. By monitoring such action, the user will be able to determine efficient (directional) or inefficient (turning) price action.
The Road Runner Forex Trader is simple, fast, and accurate, providing audio and visual signals right out of the box. It can be used with the Direct Edition of NinjaTrader and is competitively priced for Forex traders of all levels!
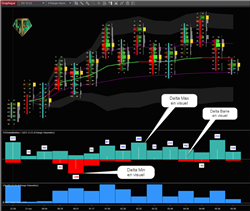
This indicator will visually tell you the evolution of this OrderFlow data: Delta / Delta Min / Delta Max. Ideal for detecting Delta divergences. No need to read the NinjaTrader statistics table anymore! Please note, you must have the NT8 version allowing access to OrderFlow.
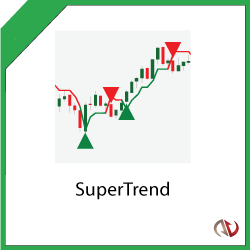
Our SuperTrend Indicator will catch the trend and improve trading consistency with smart trend-following trading signals. SuperTrend highlights trend direction, continuation and reversals while filtering out false signals. Buy & sell signals are printed onto the chart when trend direction changes.
Find out how you can identify accumulation and distribution with price action trading. Spot the footprints left by “smart money” with price and volume, the Wyckoff method way, when day trading or swing trading the stocks and futures. Join today and be part of the lifetime community group.
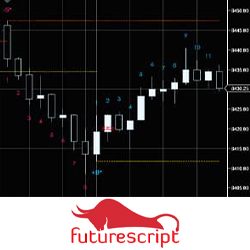
The Price Hacker introduces techniques outlined in the manual to promote the creativity of the user. The hacker section is for identifying sudden shifts in supply and demand, the staircase is used to pinpoint a break in a trend, and the sequence section evaluates the changing of the trends.
PFAHedger is an innovative addon to the PFAZoneSuite supply & demand indicator, providing the ability to submit hedging positions on any market. Simultaneously submit trades on any market while submitting hedge orders on another market, directly from the same chart.
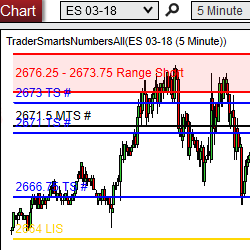
TS TradePlan is a precise support and resistance based trading plan, available for ES, YM, NQ, 6E, CL, and GC futures markets. Trade Plans are produced daily. Get started with a 2-week trial today.
December 2, 2024
Mastering Sideways Markets With Auction Bars and Range Projections
November 19, 2024
Enhancing Your Automated Trading System: Key Insights from Best Pro Trade
November 14, 2024
NinjaTrader New Ecosystem Tools: October 2024 Edition
Enter Email for Updates