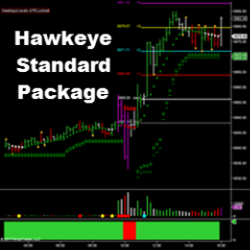
Hawkeye Standard Package is Hawkeye Traders' most popular indicators, providing trend and volume analysis across multiple markets. These powerful indicators tell traders when a trend is commencing, in congestion, and where to find the correct exit. Buy now using code: “NT10Off” for a 10% discount!
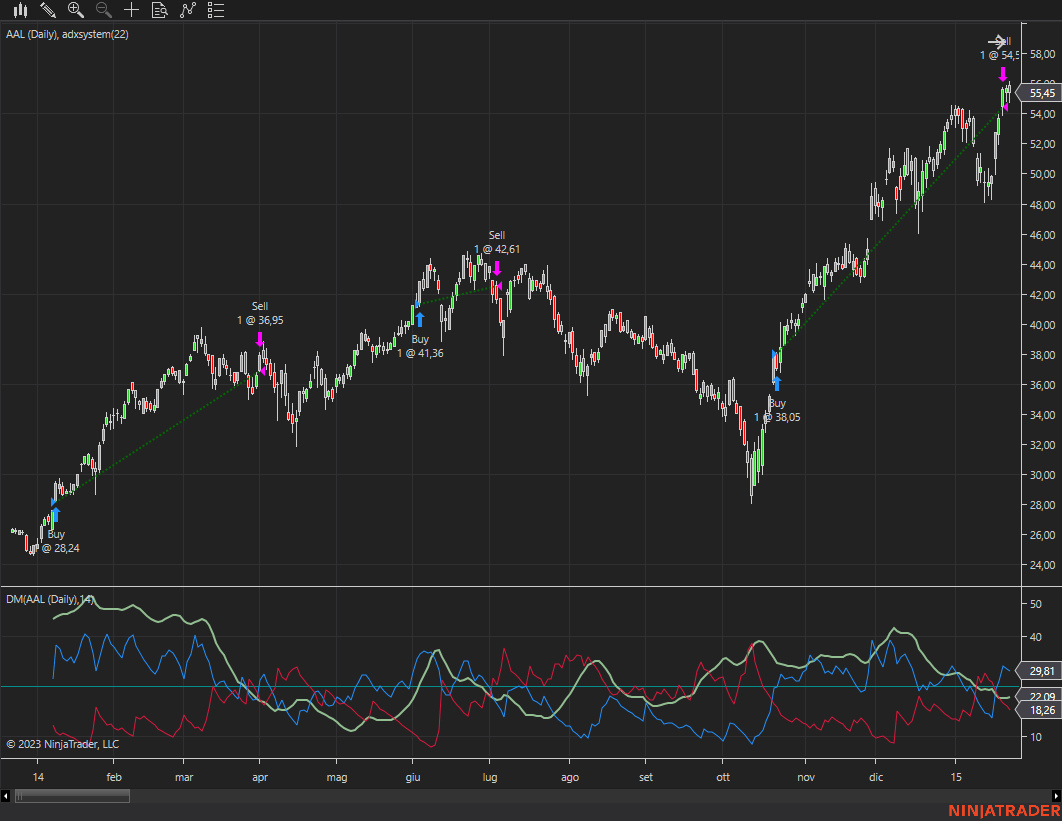
ADX trading system detecting price direction as well as trend strength.
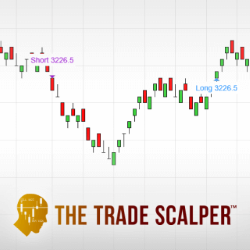
Use the Trade Scalper to pinpoint the exact moment you should place a scalping trade. What is scalping? Fast, in & out trading - multiple times per day. Included are both video and live training.
The system looks for the highest high and lowest low over past bars, then the system tags the entry with a line that is proportional to your entry settings. Then the strategy calculates: Imbalance, velocity, momentum and probability.
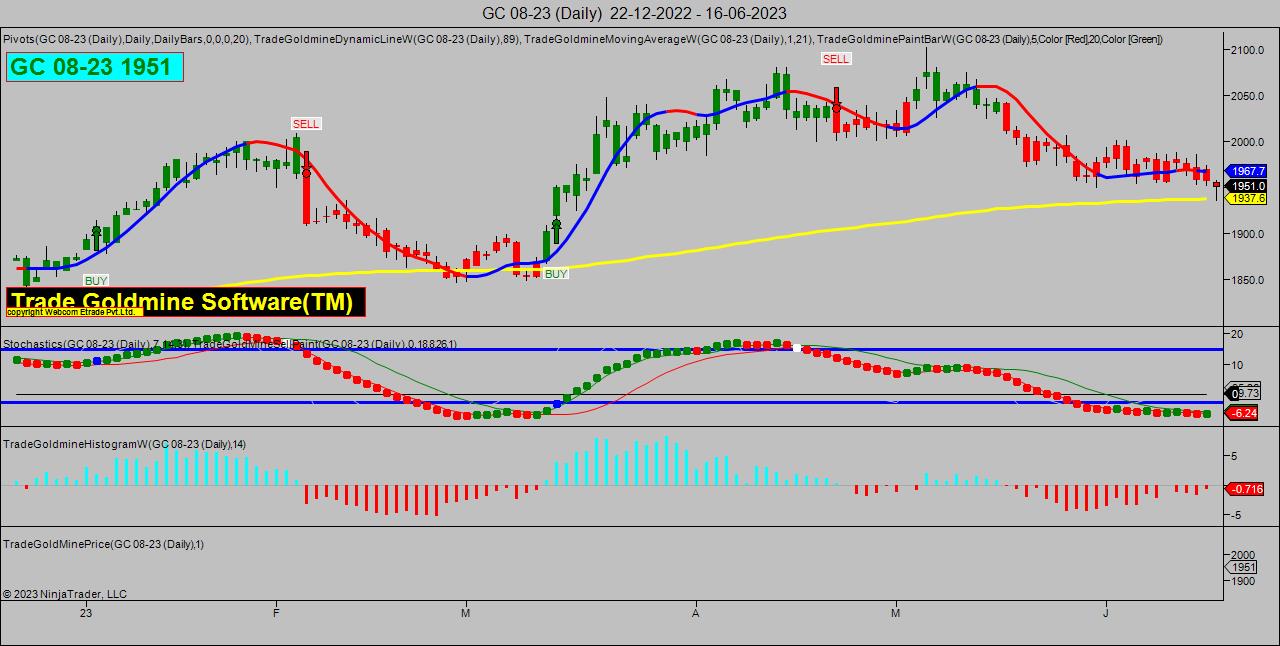
GOLDMINE NINJA TECHNIQUE software is a technical analysis tool that gives user-friendly BUY-SELL signals to traders and helps find perfect resistance & support levels in order to trade more effectively.
Patented! 'UFOs' stands for UnFilled Orders. Intelligent technology saves time and adds precision when planning entries and exits. Identify buy and sell UnFilled Orders in all markets and timeframes. Answers the question, “What is potentially an intelligent buying price or selling price?”
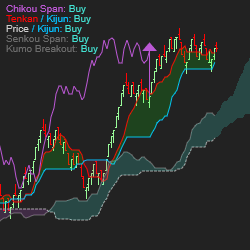
Ichimoku Kinko Hyo, which means “equilibrium chart at a glance,” is a trading system developed by Goichi Hosoda. This appropriately named system provides information about sentiment, momentum, and trend strength. It also includes quick summary on the chart!
The Epic U-Turn indicator is based on volume & previous price action to confirm that power has switched from buyers to sellers. For intraday or swing trading, these are also known as reversal bars, turnaround bars or engulfing reversal patterns. Strategy supports algo-trading. Download a free trial!
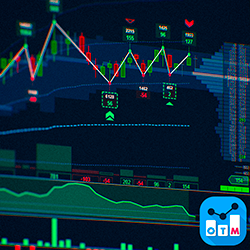
OTM is an advanced suite of delta and volume trading tools. It includes Swing, Delta Micro, Delta Bar, Cumulative Delta, Volume Profile, VWAP, and Timer. OTM provides real-time insights on buying and selling strength, synchronizing indicators for accurate trades. Improve your trading with OTM.
The CB Internals Panel shows you the breadth of the market long and short term. Combined with custom audio alert, it lets you know when the market is moving. It has been in development since 2016, and the current version stands alone.
December 2, 2024
Mastering Sideways Markets With Auction Bars and Range Projections
November 19, 2024
Enhancing Your Automated Trading System: Key Insights from Best Pro Trade
November 14, 2024
NinjaTrader New Ecosystem Tools: October 2024 Edition
Enter Email for Updates