PriceIsKing.com's Futures RAM Indicator is based on a powerful moving average pattern recognition algorithm developed with years of research and testing. Get started with a free 2-week trial today!
You can download and try our best strategies for NinjaTrader 8 now! These strategies are free to try. 24-hour technical support and all future updates included. Watch video tutorials on strategy details and how to use them. Hurry! Click here to download and try now!
The Lighthouse Trading strategy works fully automatically in the futures market. Besides trading in different markets simultaneously, you can configure it in distinct ways in each one of them. The algorithm analyses time and sales, volume, rhythm and acceleration in real time.
Elevate your trading strategy with the DR/iDR Indicator for NinjaTrader: Your essential tool for identifying key price levels. This advanced indicator displays both the Daily Range and the Implied Daily Range directly on your trading charts, providing crucial insights.
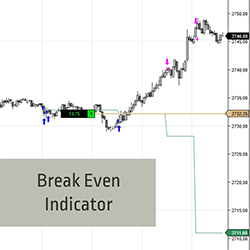
Want to hold on to trades longer? The Break Even indicator calculates profits taken into the average price of the remaining position. See the Break Even line move away from price & gain additional confidence to remain in your trade! It works for both long & short trades. Start your 2-week trial now!
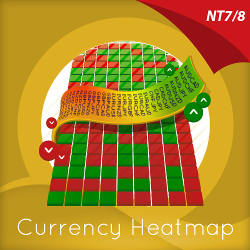
The Currency Heatmap displays the “hottest” and “coldest” areas of the forex landscape. Vertically, 28 currency pairs are listed and ranked from the most bullish to the most bearish. Horizontally, each cell then displays bullish and bearish sentiment across multiple timeframes instantly.
B4 CoPilot simplifies trend direction with a visual representation in chart background colors, shows optimal trade entry points with arrows and price regions. It also has several models that execute semi-autonomous order flow entry, using our institutional grade day trading engine.
Start with an idea, work with our development team and then test your strategy. If it functions well, next deploy the strategy in paper trading mode and track each day’s performance. We provide support in Portuguese.
Choose from an assortment of indicators with enhancements not found anywhere else. (Digital Clock, Bar Timer, Divergence, Price Channel, Current Bar Range). Get free trials of these unique indicators now!
Thapelo FX Knight Trading Academy is a trading training academy, helping amateur to middle traders gain their consistency in the trading industry.
December 2, 2024
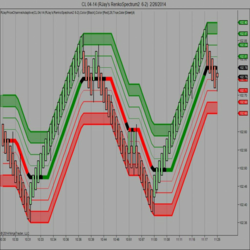
Mastering Sideways Markets With Auction Bars and Range Projections
November 19, 2024
Enhancing Your Automated Trading System: Key Insights from Best Pro Trade
November 14, 2024
NinjaTrader New Ecosystem Tools: October 2024 Edition
Enter Email for Updates